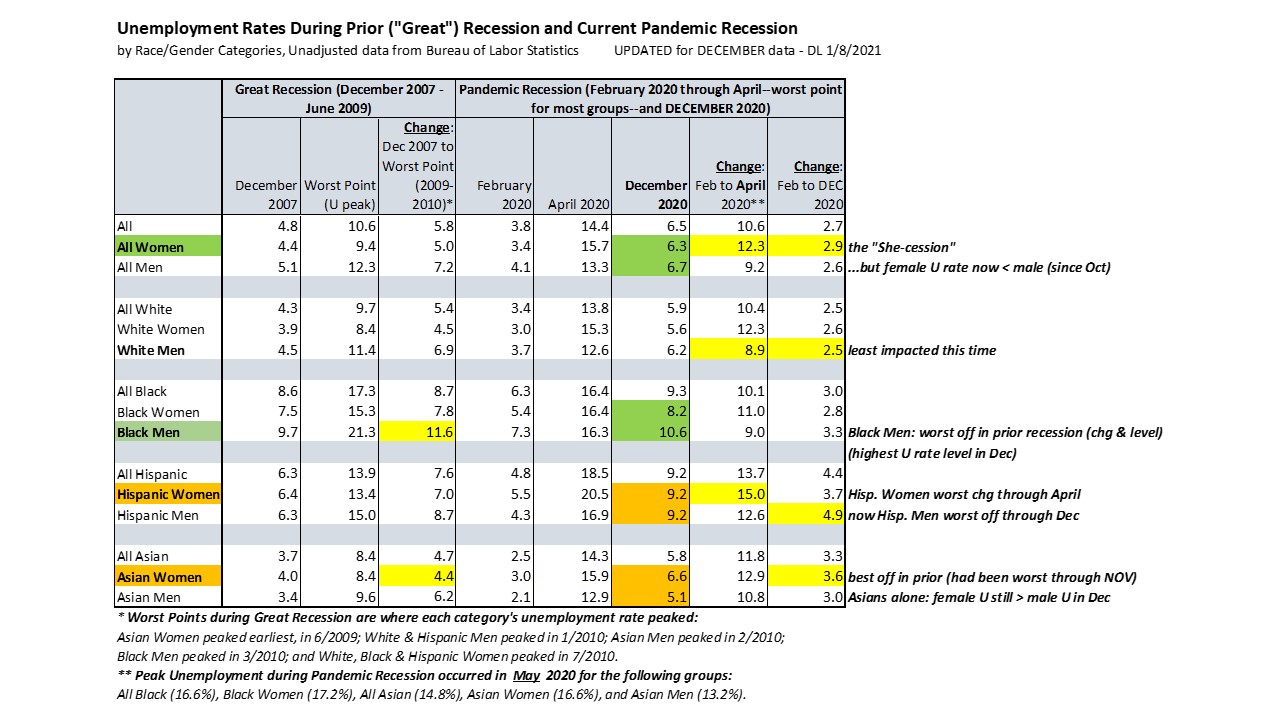
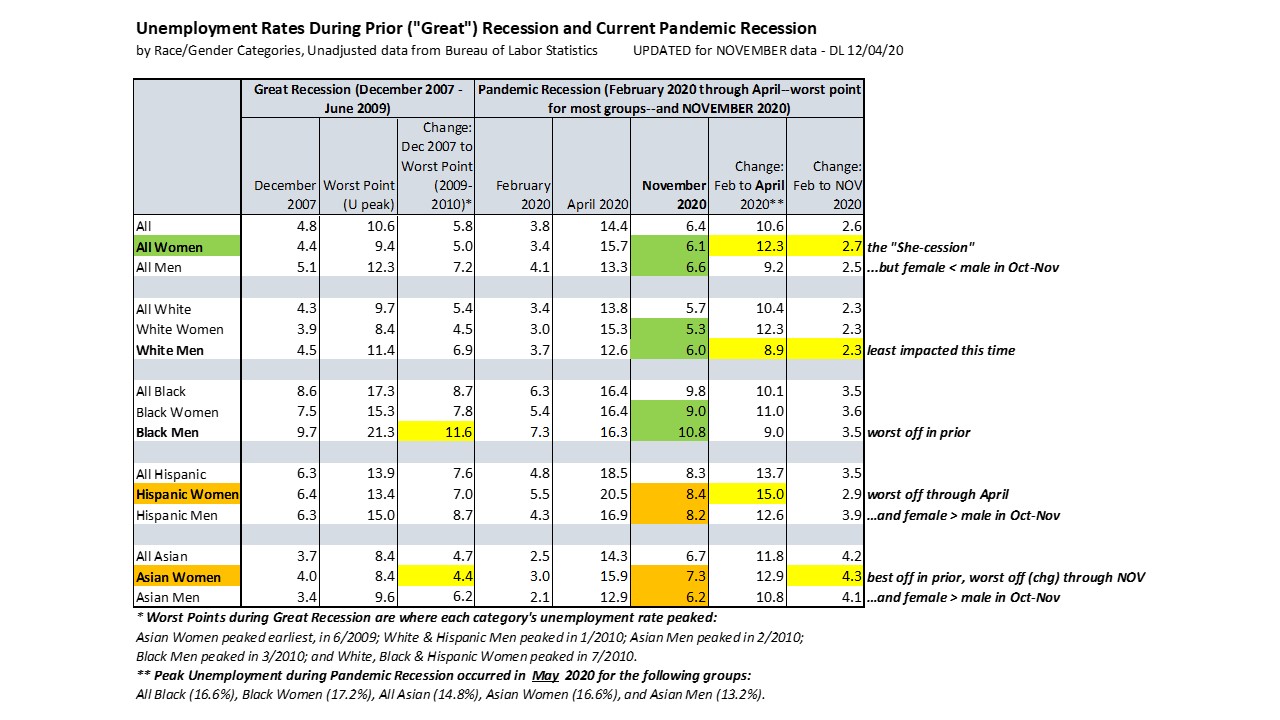
I never posted my tables and charts through the December report (released first week of January) here. In a few minutes we get the January numbers, so here’s the bottom line as of the end of 2020: the so-called “She-cession” with female unemployment exceeding male only still held among *Asian* women as of the end of 2020! Here’s the table which underscores how we can’t generalize about how women vs. men are doing–or how anyone in the economy is doing–based on our usual aggregate and average statistics. I’ll have more to say on this topic of the need for more granular data in the future, maybe even this coming week when I next update employment stats based on the numbers we’re about to see.
Here are some charts (and one table) I updated today in my employment status by race and gender analysis I’ve been doing since the summer. Crossposted in this (poorly numbered) Twitter thread here. All based on monthly (through November) unadjusted data published by the Bureau of Labor Statistics accessible here.
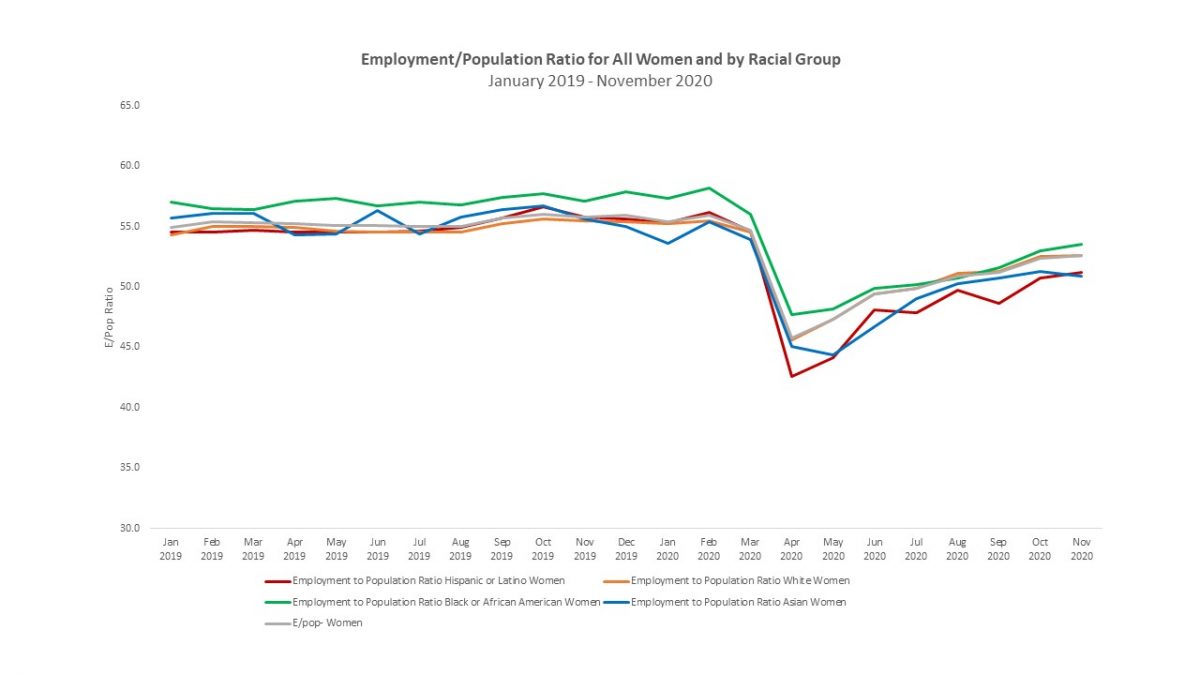
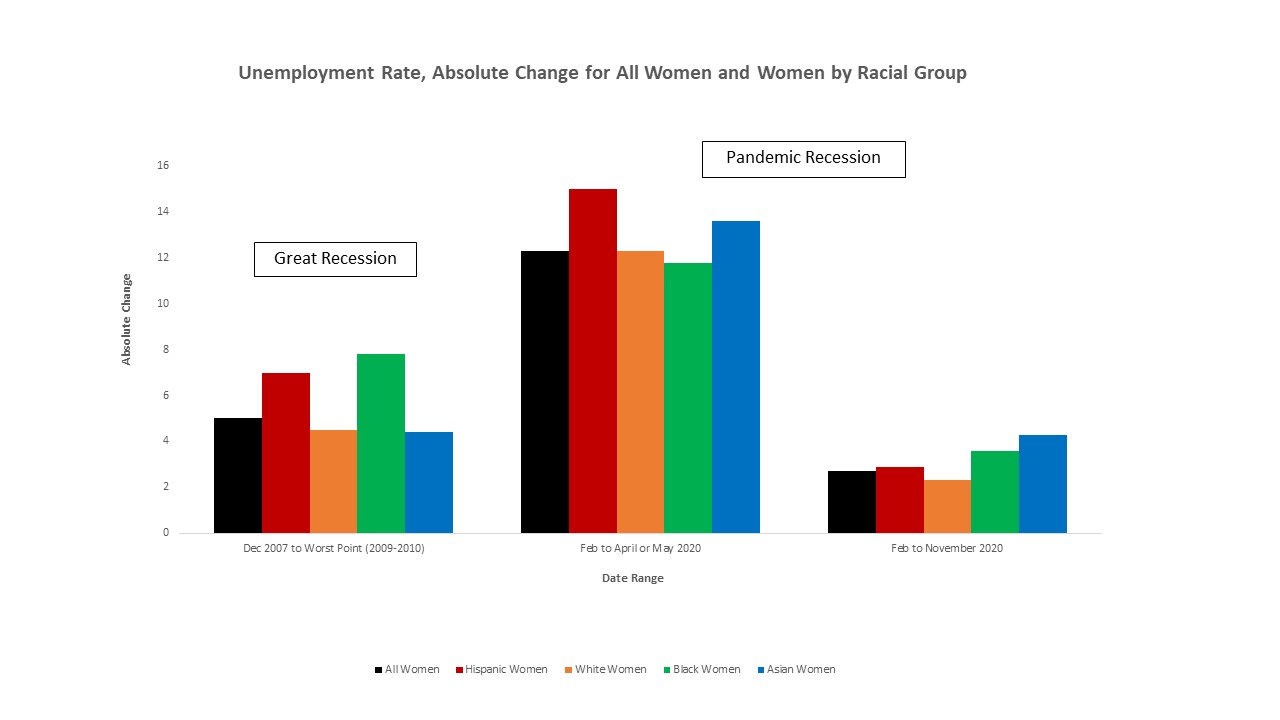
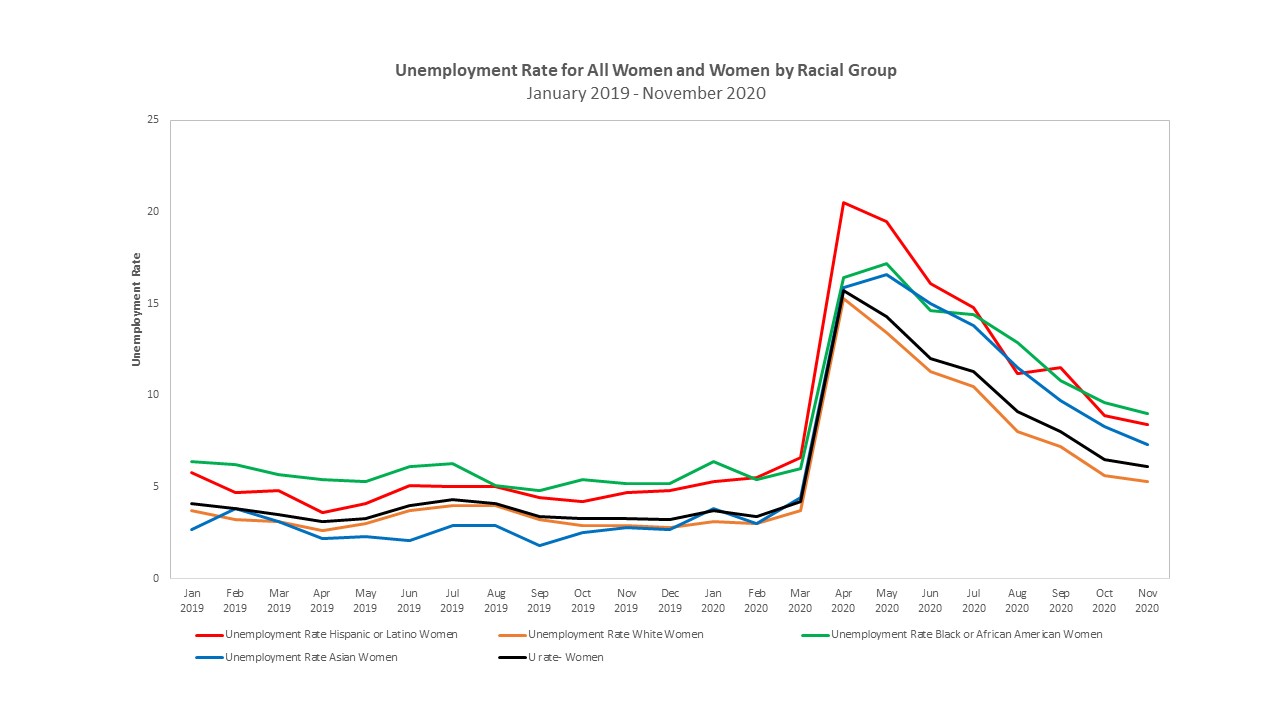
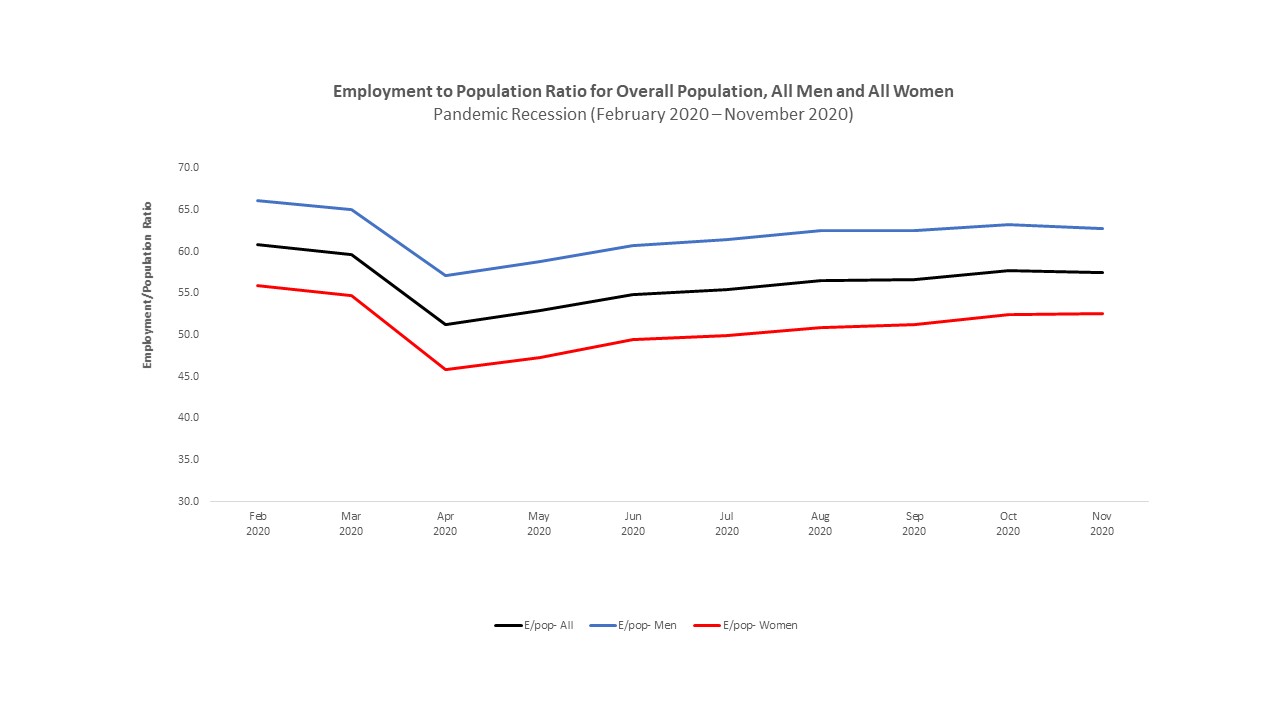
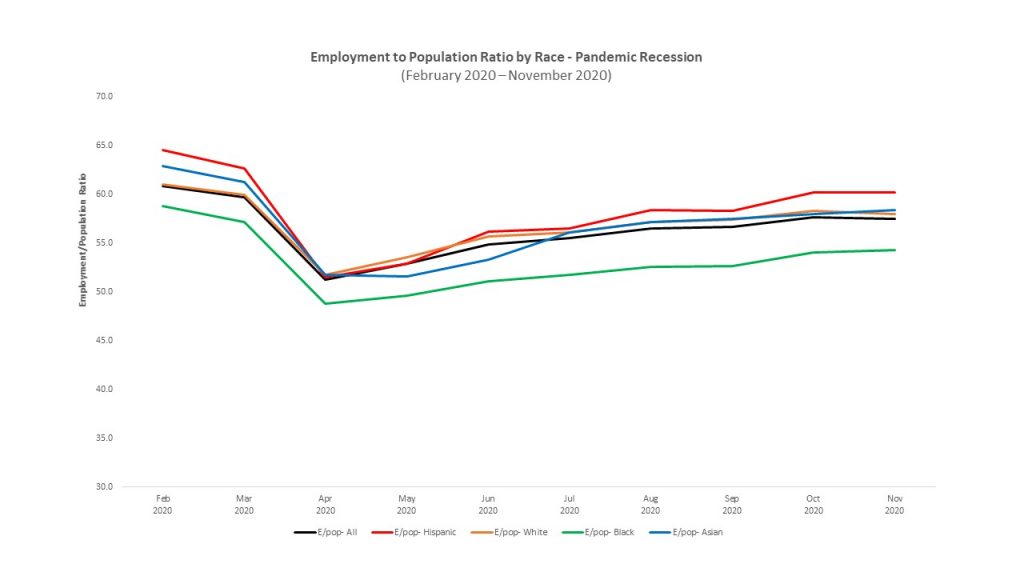
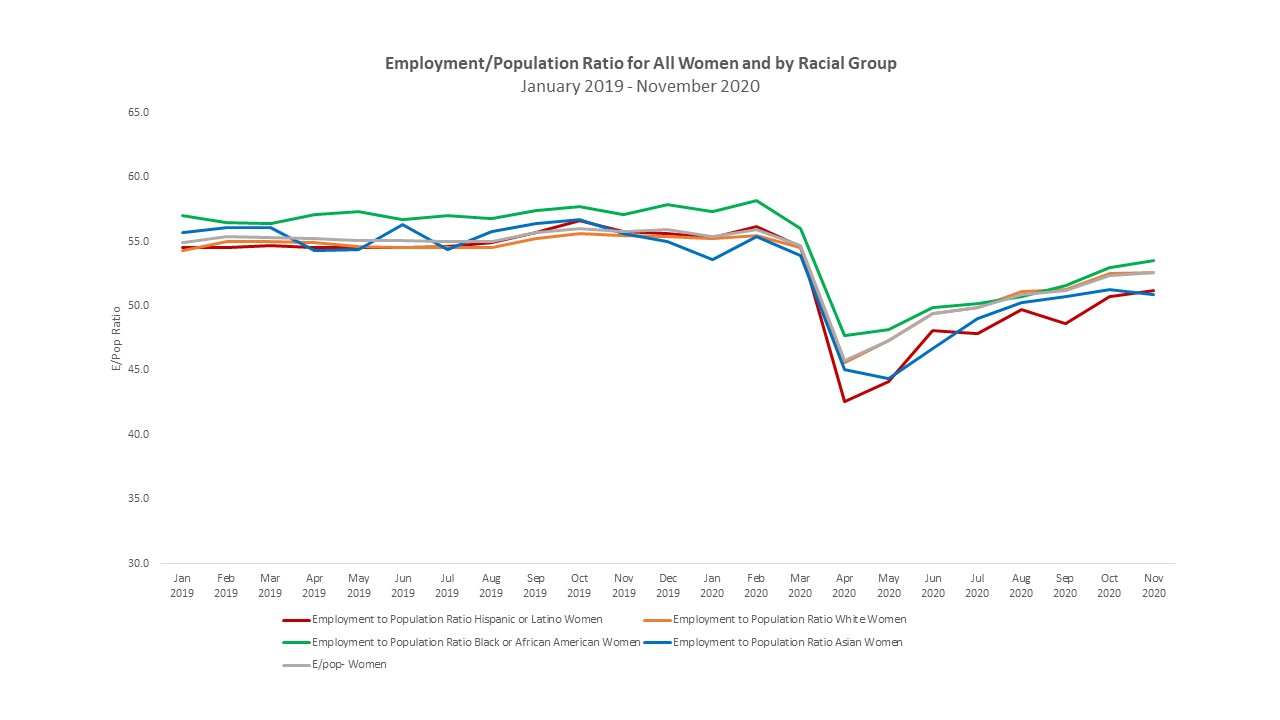
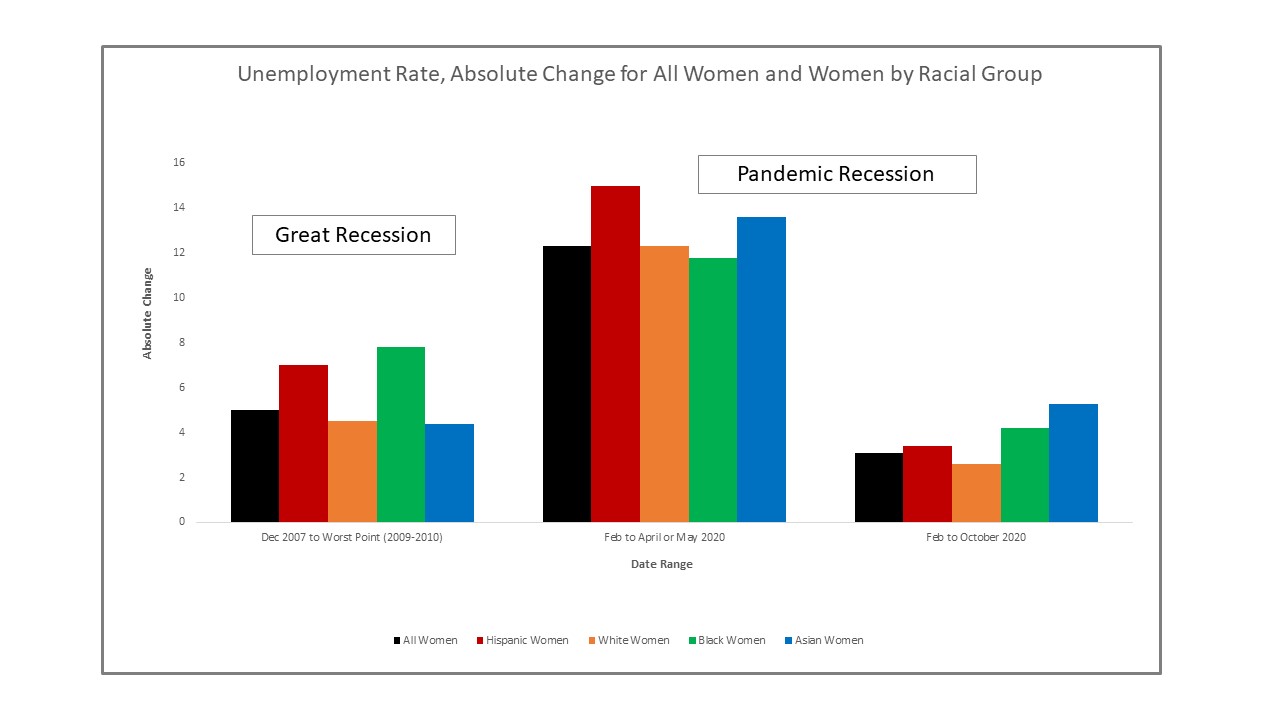
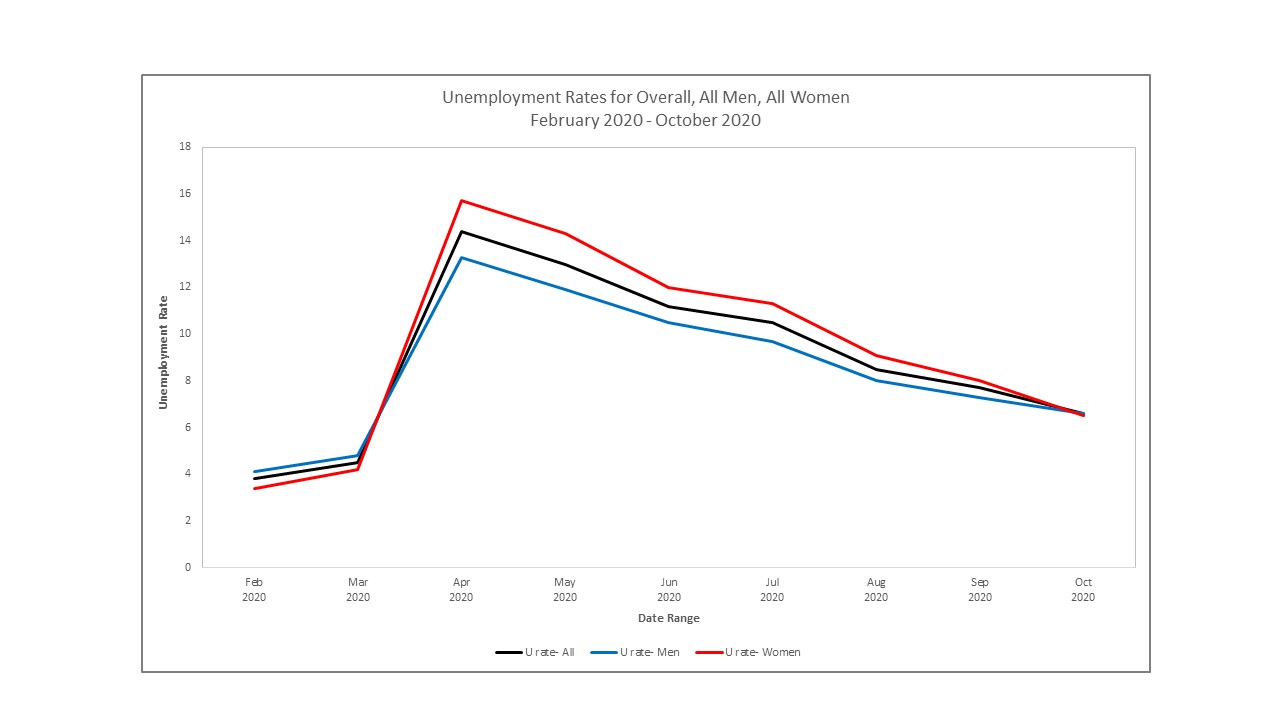
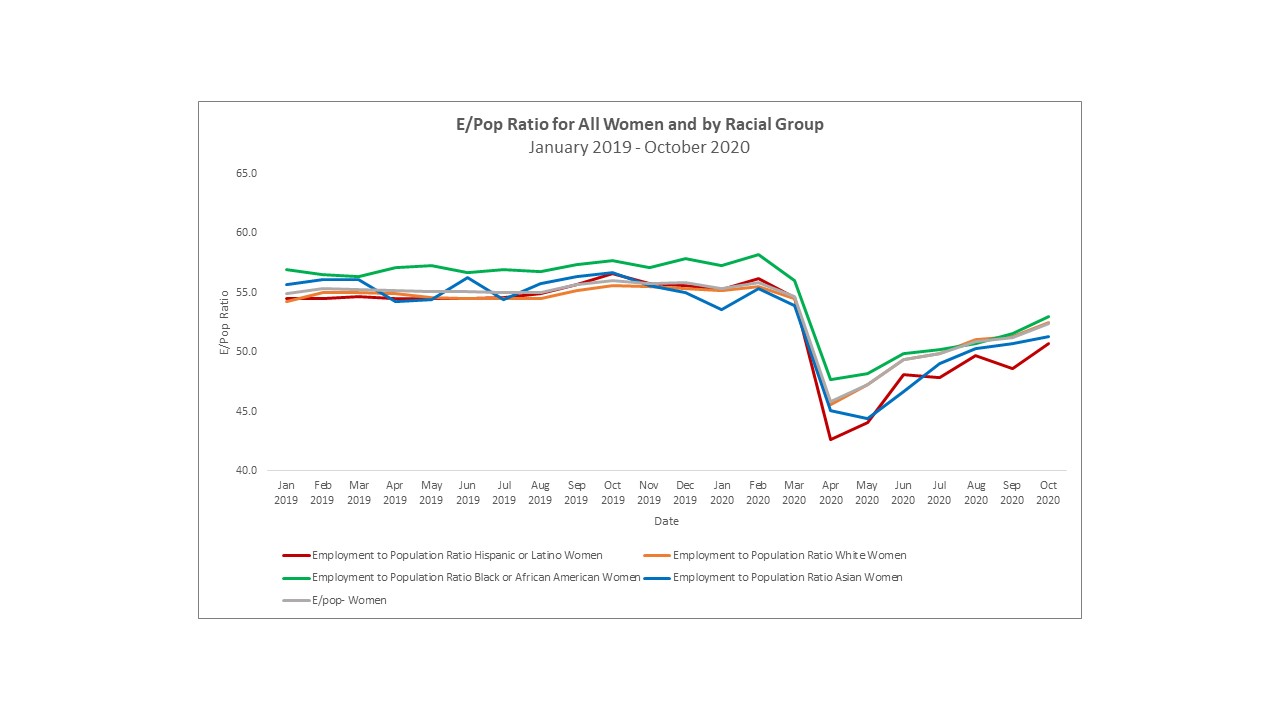
Absolute change in unemployment rates among women by race — comparing the Great Recession with the Pandemic Recession. The largest increases in unemployment have been among women of color–Hispanic and Asian women at the start of the Pandemic Recession, but through November (all groups of) women of color still had experienced larger increases in unemployment than White women.Unemployment rate for all in the labor force (age 16+), all men (blue), and all women (red), during the Pandemic Recession (Feb-Nov 2020). Note that female unemployment surged past men’s at the peak of the recession in April, but since October, the overall male unemployment rate has exceeded the female rate.Female unemployment rates by race since January 2019. Before the pandemic, Asian women (blue line) typically enjoyed the best labor market outcomes and experienced the lowest unemployment rates, but in this Pandemic Recession their unemployment has increased the most and they have looked much more like other women of color (Hispanic/Latina and Black women) than like White women. In November, Asian female unemployment was still two full percentage points above White female unemployment. Male (blue) and female (red) employment-to-population ratios during the Pandemic Recession (Feb 2020 – Nov 2020). Hard to see any interesting differences by gender when everyone is lumped together/averaged out! (Note that men have always had higher E/pop and the male and female levels appear to have moved together during this recession.)Differences by race (men and women combined) in employment-to-population ratios are clearer. Note that Hispanics started out with highest E/Pop and dropped the most in the spring but have also recovered the most since the spring.Looking at women by race, we see clear differences in the levels and trends of E/pop. Note that Asian women (in blue) for much of 2019 had the second-highest E/pop (closest to Black women, in green), but looked more like Hispanic women (in red) this recession and as of November had the lowest E/pop among all women by race.Summary table of unemployment rate levels and changes for all race-gender categories, comparing the Great Recession with the Pandemic Recession.
Top line story is that yes, this Pandemic Recession has been one that’s disproportionately burdened women and especially women of color, but as the months are approaching a year, we’re seeing that even White men will not come out unscathed. With today’s report on the November employment situation–the rise in long-term unemployed, the slowing of the recovery in labor force participation and the employment-to-population ratio as people sit themselves on the sidelines (hunker down at home) and literally “wait” for the public health crisis to end–we can see that the labor market impacts we’ve suffered so far are going to take awhile to recover from.
For students who are looking for a job in their specialty, an important factor is the presence of an essay, many resort to quality essay writing service. In the present conditions, the competition for a job is very high.
For economic policy to be most helpful to the labor market recovery, it will have to address all the conditions that are holding back work both at the workplace (the demand side, where certain places and types of work are still not safe to return to) and the home (the supply side, where many parents are now full-time caregivers given school closures). This is truly not a typical economic recession–it is not just dubbed the “Pandemic Recession” but is literally driven by the pandemic. So first and foremost, we need to get the public health crisis under control. (And that means listen to Dr. Fauci’s advice about wearing our masks and avoiding social gatherings as we wait for our vaccine.)
With Joe Biden having won the presidency as of yesterday (11/7/20), the new labor market data that came out the day before was amazingly aligned with voting patterns, which show men more often voting for Trump, women and especially women of color more often voting for Biden, and Trump (vs. Biden) voters more likely to put the economy (vs. the pandemic) as their biggest concern. The Bureau of Labor Statistics’ report on the monthly employment situation, and their underlying survey data (not all published in the report but accessible here and here) show that while the labor market continues to improve since its worst point this spring, the continued severity of the pandemic continues to weigh on women’s work far more than men’s. The “SheCession” (or is it “She-session” as Heather Long of the Washington Post recently called it… either works to me) is still an acute condition, particularly for women of color.
Below are the latest numbers (in table and charts) on unemployment by race and gender categories and comparing the current Pandemic Recession to the Great Recession. Through September, only Asian women were still at a higher level of unemployment than at the worst point of the Great Recession. As of the latest data for October, all race-gender categories have seen unemployment continue to fall to the point where even Asian women are now (slightly) better off (at 8.3% unemployment) than they were at the worst point of their Great Recession experience (which was 8.4%).
October is the first month since the start of the pandemic that we saw the overall female unemployment rate (at 6.5%) fall below the overall male unemployment rate (at 6.6%). But the differences across race are stark: among Hispanics and Asians, female unemployment still exceeds male unemployment. Factors driving the “SheCession” on both the demand and supply sides of the labor market make the explanations complicated and impossible to generalize. (Further interdisciplinary study–starting with interviews and focus groups, then moving to more detailed surveys and analysis of collected data–is needed.)
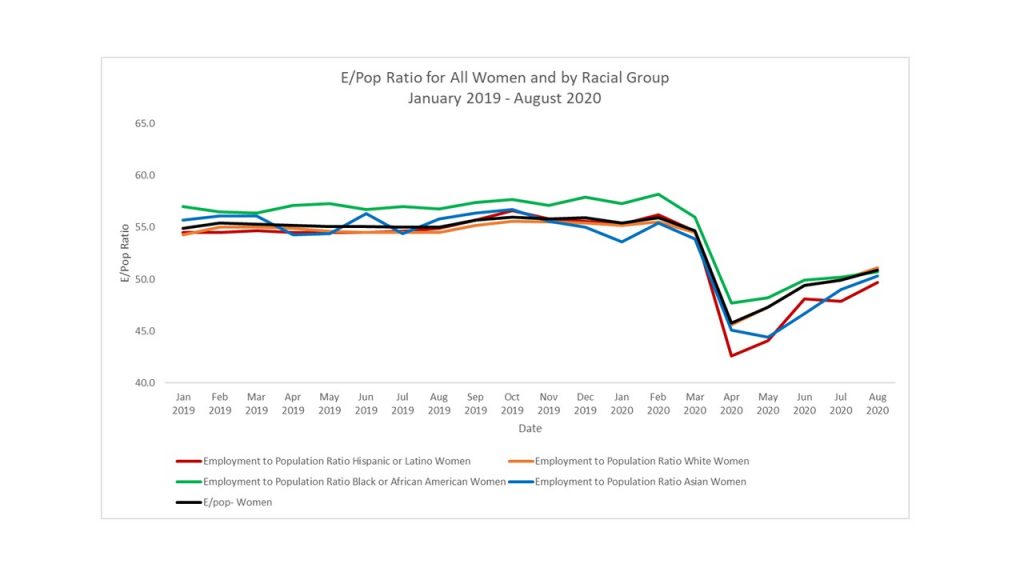
The larger toll of the pandemic on working women doesn’t just show up in the unemployment rate measure–which is still nearly double its February pre-pandemic rate and which can be misleadingly reduced when people drop out of the labor force entirely, which reduces the numerator (# of unemployed) by a larger proportion than the denominator (# in labor force = # unemployed + # employed). The “SheCession” also shows up in the employment-to-population (E/Pop) ratio:
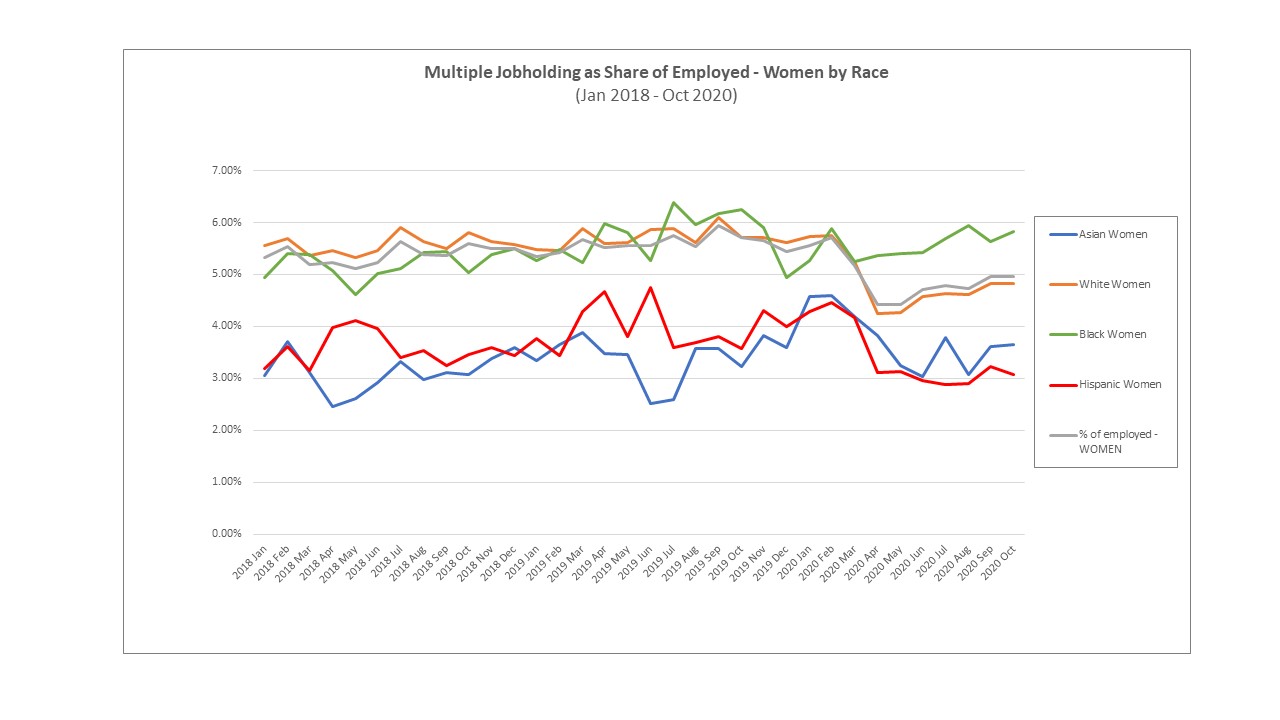
And the SheCession shows up in the multiple jobholding data, where working women more commonly than men work two or more jobs (as has always been true because women more commonly work part-time rather than full-time jobs whether by preference or not), but in the pandemic recession have had to piece together and juggle multiple jobs along with their unexpected and unpredictable caregiving responsibilities at home. Note that during the pandemic we have seen the distribution of multiple jobholding among women widen across both race and age categories–with Black women and the youngest women most likely to be working multiple jobs:
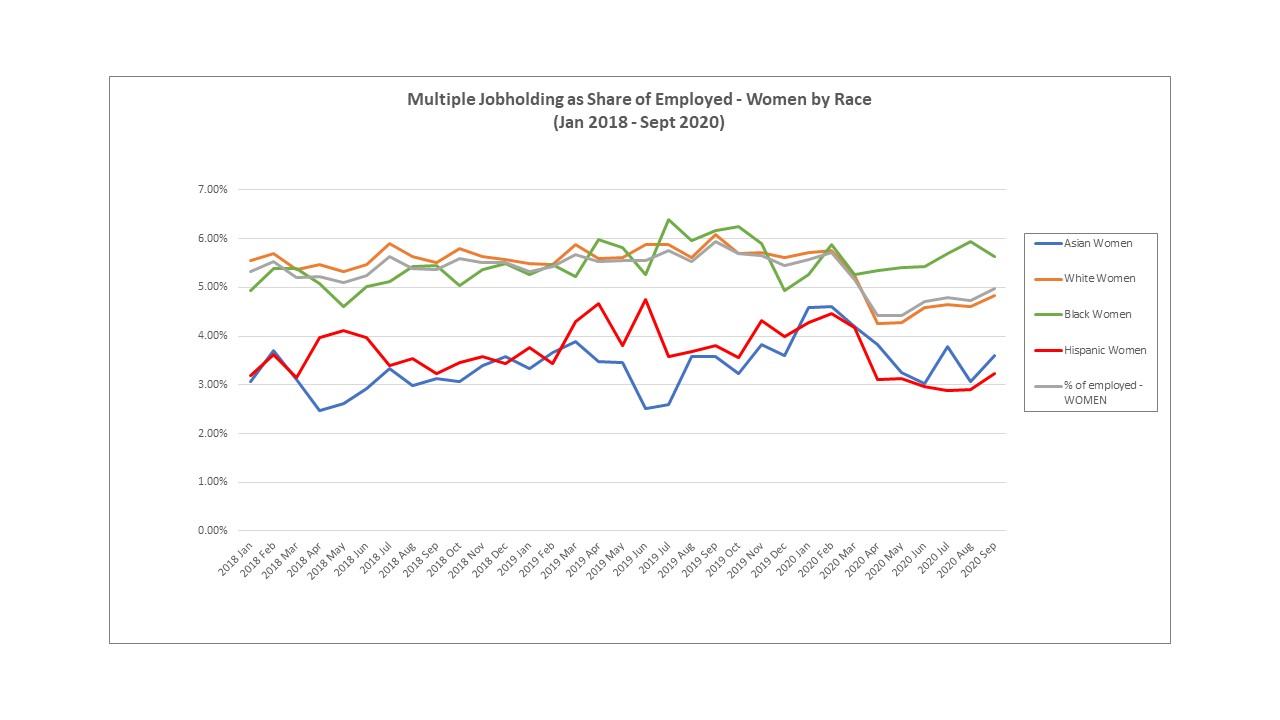
To follow up on last week’s post showing how women are still more likely to be working multiple jobs than men (both among the employed and among their total populations), here’s a reminder that not all women are the same. Let’s look at multiple jobholders as a share of employed, across race and age categories.
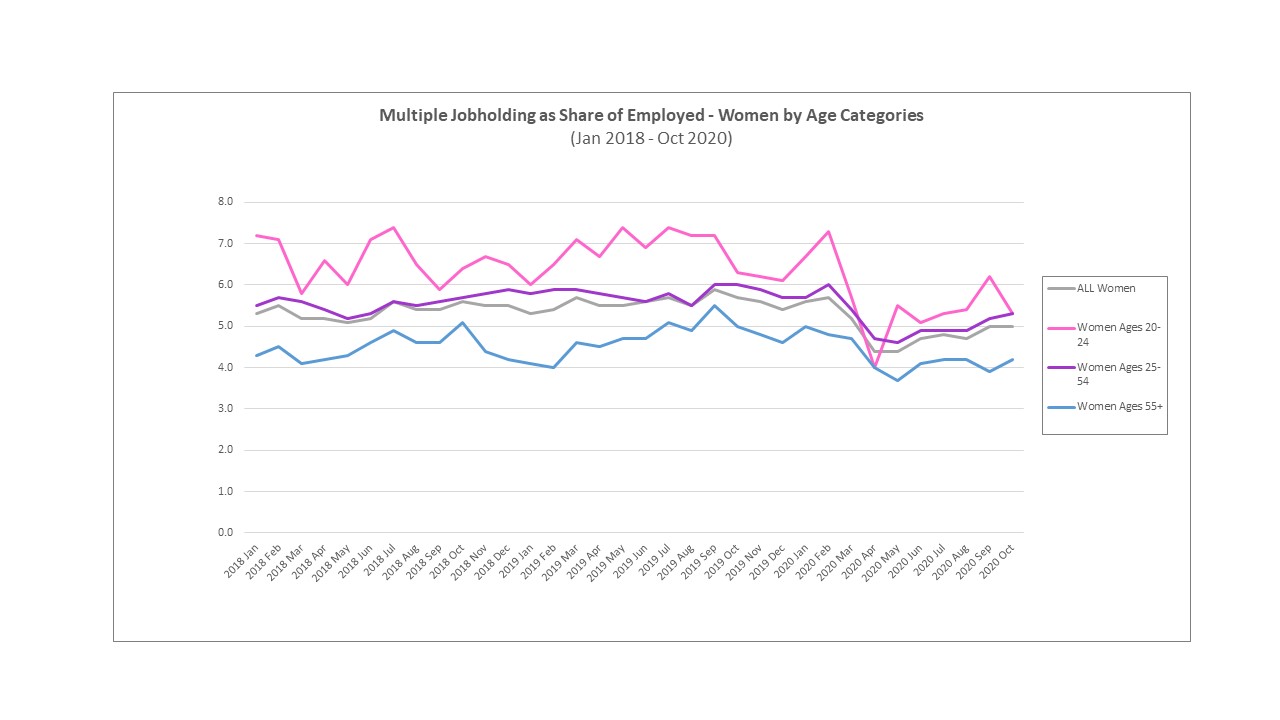
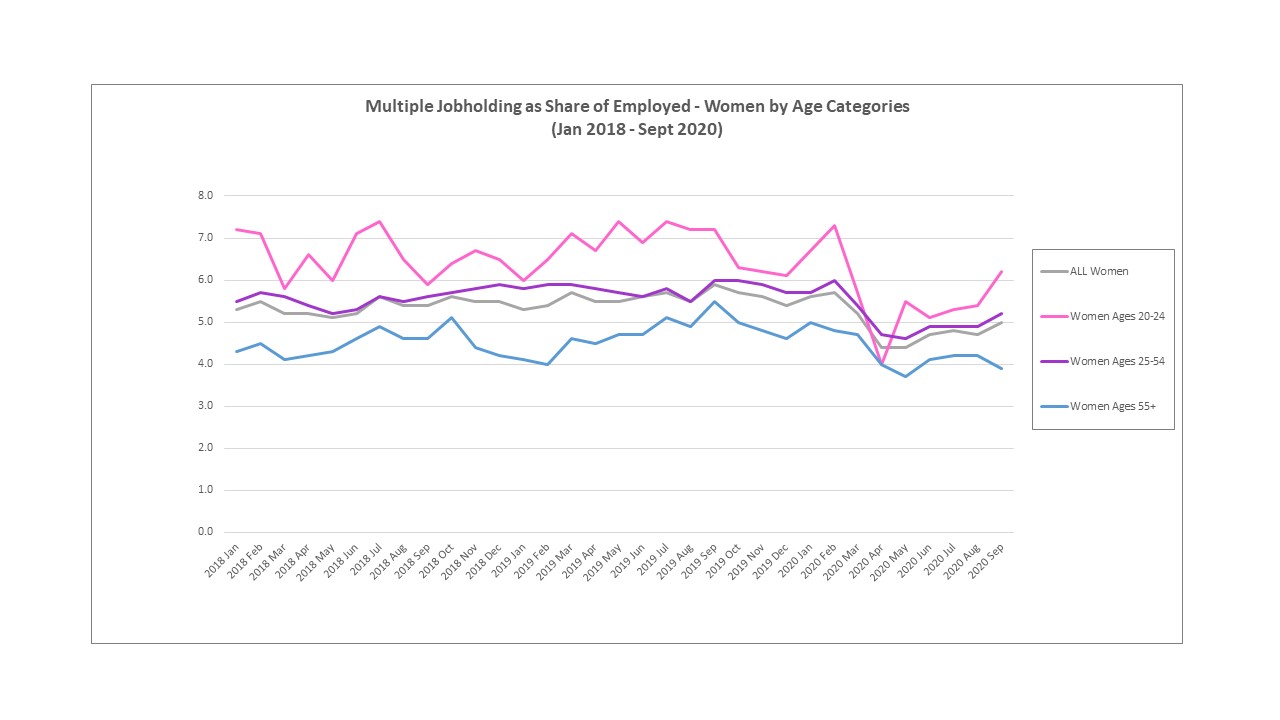
Black women are substantially more likely to hold multiple jobs than any other race categories of women. Notably, while multiple jobholding fell for all groups in the spring when unemployment peaked (and number of overall jobs in the economy cratered), multiple jobholding as share of employed has already (as of September) returned to a “normal” level for Black women but not for other women.By age categories, the youngest of working women (ages 20-24) have always been the most likely to hold multiple jobs, because they are most likely to have to piece together multiple part-time jobs (often in the leisure/hospitality sector) to make a living. These women were most likely to lose at least one of their multiple jobs at the start of the pandemic, and regain work as businesses reopened in the summer.
There are many factors that could explain the differences by race, probably most significantly that Black women are more likely to be sole earners in their households (as well as single parents) yet also more likely to earn lower hourly wages. The different trends by age reflect that multiple part-time jobs are often the closest a young adult (even a college-educated one) can come to a full-time job–and that the human-service-intensive jobs many young women work in were the ones that disappeared the most at the start of the pandemic and have not and will not likely fully come back even when the public health crisis eventually wanes. The Pandemic Recession — or “She-cession”– has not just been hard on women because of the severity of the lowest depths of job loss experienced, but because it’s really “jerked around” the women who were already the most economically vulnerable.
Here are a bunch of charts that illustrate why the Pandemic Recession is also sometimes referred to as the “She-cession.” These are based on BLS monthly data through August (released last Friday, Sept. 4). I’m also re-posting the bar charts I put up on Twitter and here last Friday, so the latest figures are in one place. (See original post on “Seeing Asian Women…” here and the table with all the unemployment data through August by race-gender categories here.)
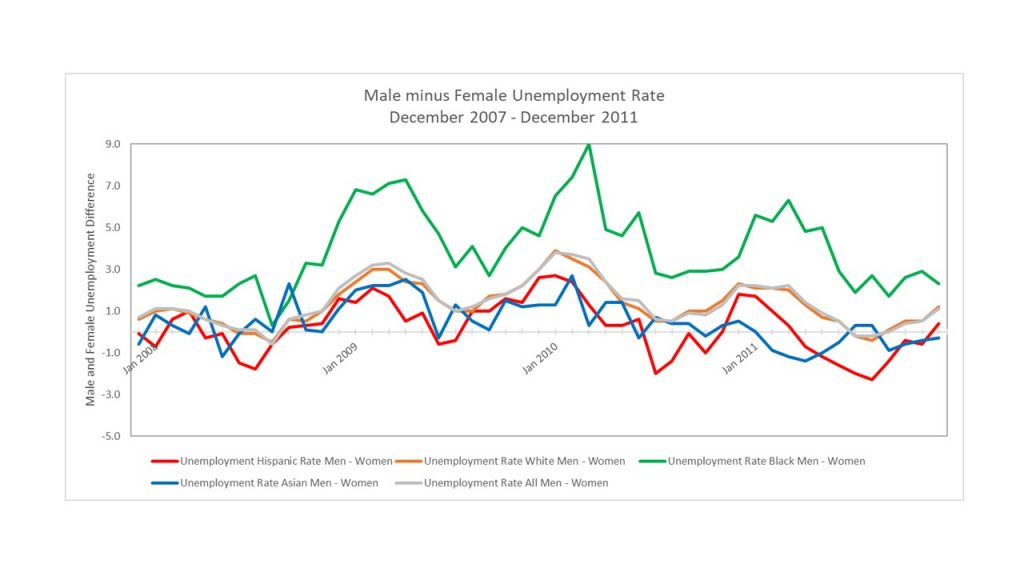
First, compare male minus female unemployment during the Great Recession to during the Pandemic Recession (thus far):
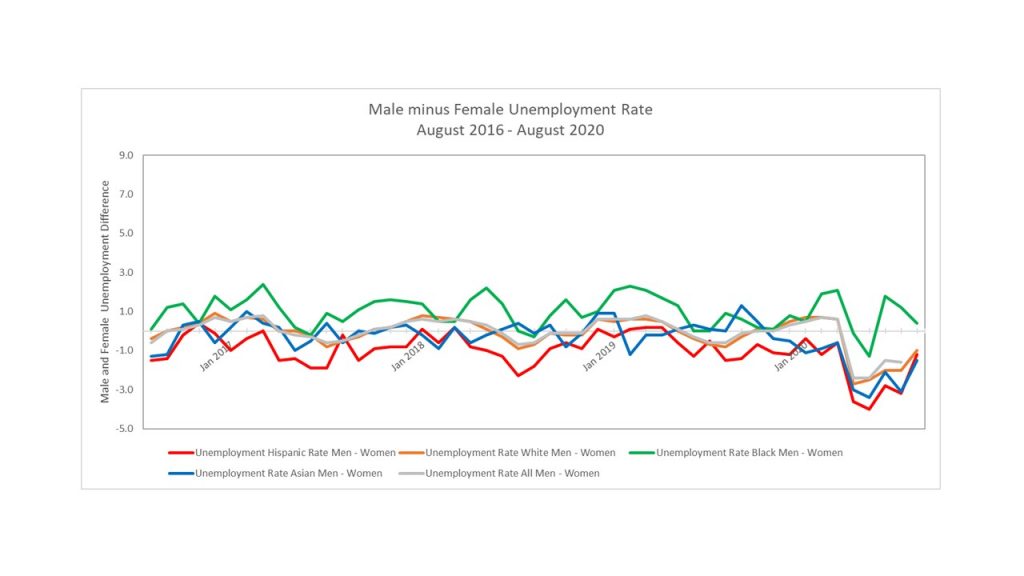
During the Great Recession (Dec. 2007-2009/10 recovery period), male unemployment relative to female unemployment grew dramatically–and in general/overall male unemployment stayed higher than female even years after.During the Pandemic Recession (since Feb. 2020), female unemployment increased dramatically and surpassed male unemployment in all racial categories, and only among Black workers did male unemployment again exceed female unemployment this summer.
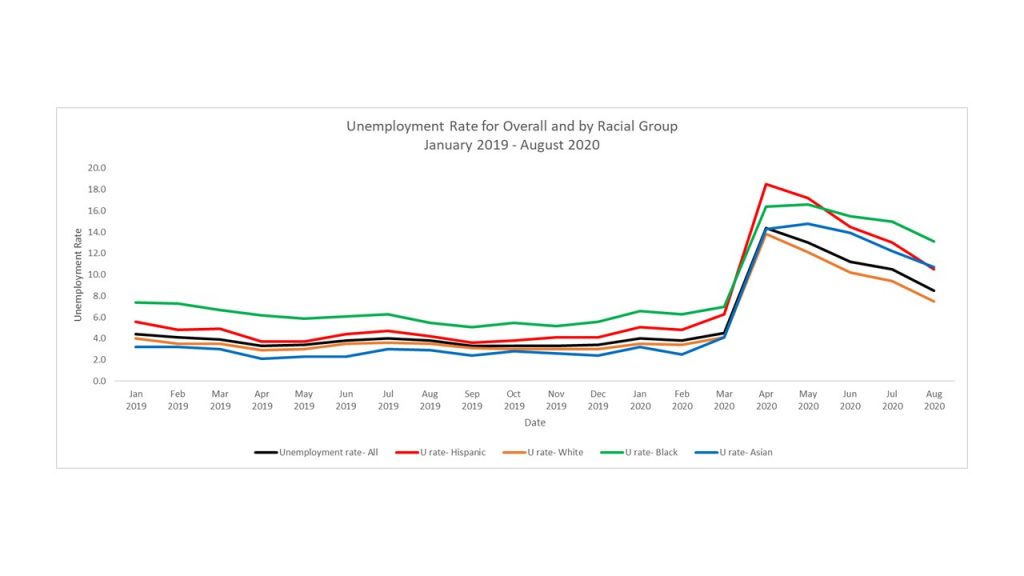
The differences in unemployment across racial categories have been stark. It’s not just a recession with disproportionate impact on women, but one with disproportionate impact on people of color. Zooming in a bit more recently, here’s what the unemployment rates by race since January 2019 look like:
Unemployment rates by race categories, men and women combined. Note that Asian unemployment started the very lowest in February 2020 and is the second highest in August 2020.
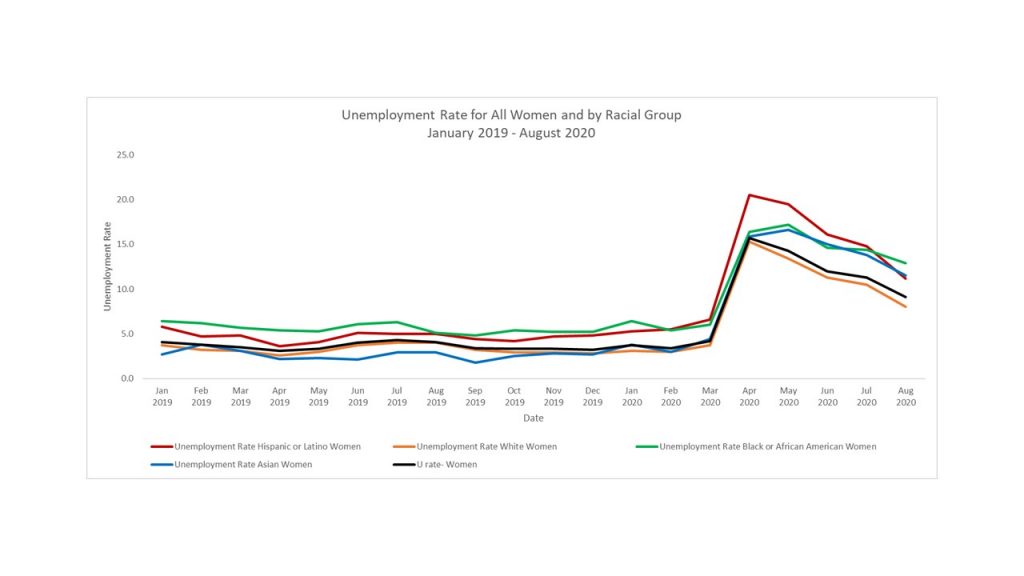
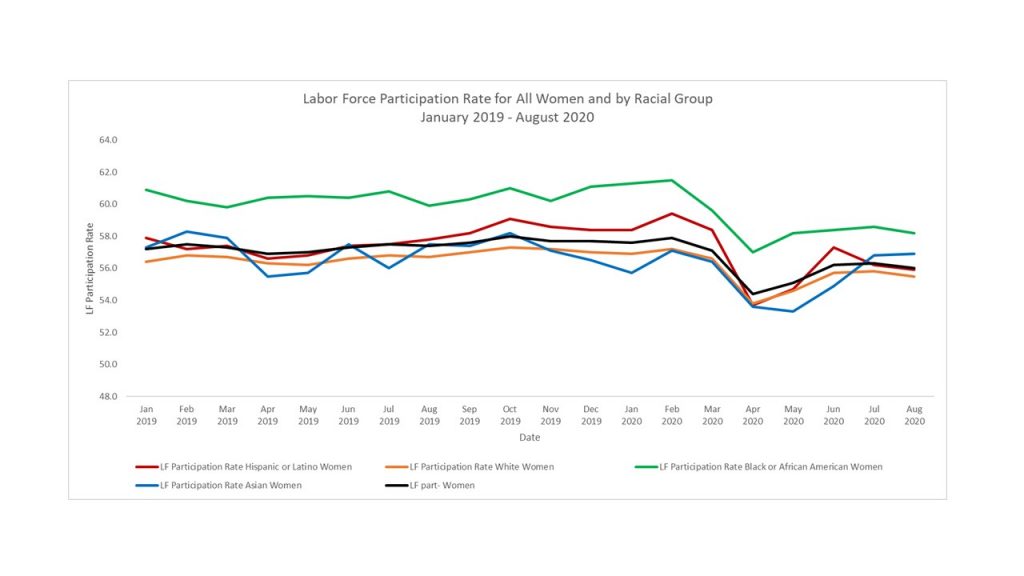
Going back to looking at the employment outcomes among women by race over the past year and a half (since January 2019), here are charts showing the unemployment rates, the employment-to-population ratios, and the labor force participation rates:
Female unemployment rates, by race, January 2019 through August 2020. Note that like for race categories overall, Asian females had the lowest unemployment rate in February 2020, but in August 2020 have the second highest–as Hispanic female unemployment has shown the best recovery since its peak in April.Female employment-to-population ratios by race, January 2019 through August 2020. Hispanic women had the lowest e/pop at worst part of the Pandemic Recession and have traded places with Asian women a couple times since. Black women had had the highest e/pop going into the pandemic but in August, white women had surpassed black women.Female labor force participation rates by race. Asian female participation was relatively low pre-pandemic, but is second highest this summer–showing that many Asian women consider themselves still “in the labor force” even if currently unemployed.
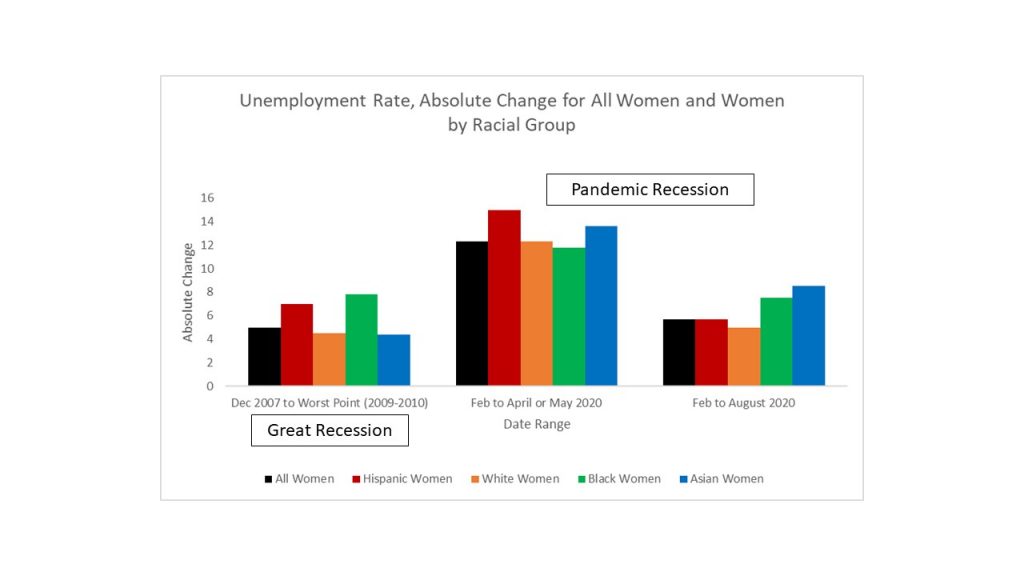
And below is the headline bar chart I previously posted comparing absolute changes in unemployment rates for women by race in the Great Recession vs. during this Pandemic Recession (through August):
The Pandemic Recession is a “She-cession” and has had disproportionate impact on women of color, particularly on Asian women–who face a still higher unemployment rate in August (at 11.5%) than at their worst point in the Great Recession (8.4%).
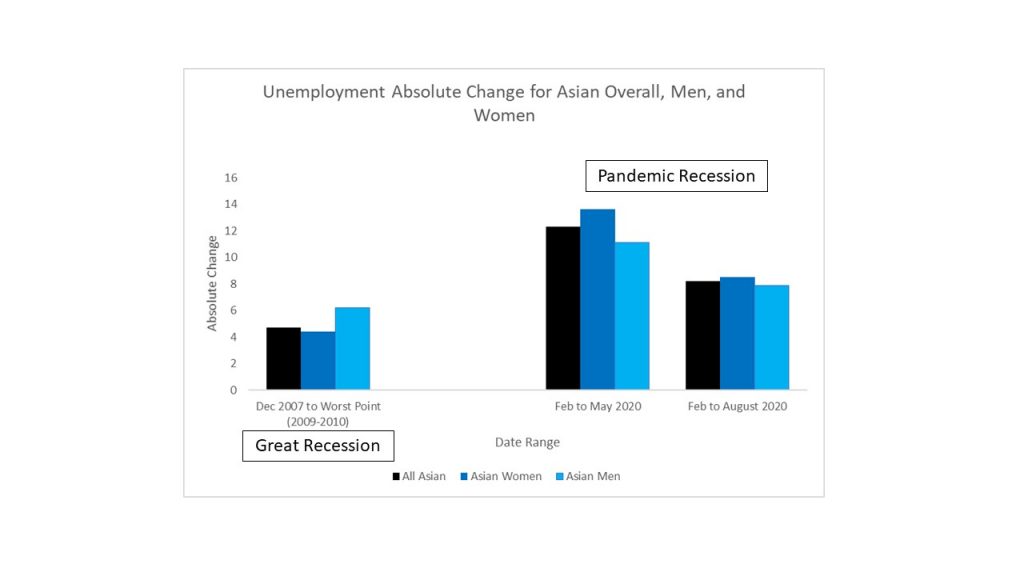
And looking at Asians alone (both men and women), the “double whammy” of being both Asian and female in this Pandemic Recession is underscored:
Asians (especially the women) had very low increases in unemployment during the Great Recession relative to other race categories. This time is totally different.
The latest Bureau of Labor Statistics employment report (for July 2019), which came out on Friday, was kind of “same old, same old”: service-providing jobs (particularly in healthcare) strong, goods-producing jobs weak, the pace of job growth holding steady, the unemployment rate still really low (3.7%), and wages still rising decently. We’re now in the slowest, steadiest economic expansion on record (since June 2009 according to the NBER), and economists are constantly looking for signs we are finally due for a downturn and pondering if the signs we’re used to looking for aren’t so obvious anymore. With our mix of people who are the foundation of our economy, and the things we people (vs. robots and other countries’ people) do, changing all the time, I often wonder how economists can assume that the patterns the U.S. macroeconomy has followed in the past are well-informing our assessments of where we are headed. How can we predict or even recognize what we haven’t really seen before–something that might be called a “new normal” (clearly, an oxymoron).
One way we know that the economy is different from the last expansion, just from living and looking around us, is the changing nature of work. There are more “gig” or independent workers in the economy now compared with the last expansion, facilitated by the development of mobile online labor platforms that have made it possible for people to supplement their incomes from their main or “real” job with the income from being a Lyft or Uber driver, or a Rover dog walker, or a Thumbtack handyman, or a Grubhub restaurant-food deliverer. Technological advancements alone have likely made this economic recovery’s labor market look different from that of the last one–before such “gigs” ever existed.
So I decided to dig a little deeper into the latest jobs report to see what I could see as any evidence that this was not entirely just a “same old, same old” employment report during a typical (but long) economic expansion. It seemed to me that given the rise of alternative forms of work over the past 10 years, we might expect this to show up in the BLS data on workers who hold multiple jobs. An in-depth analysis of the household data on multiple jobholders was published in the BLS’s Monthly Labor Review in April 2015 on data that ran (only) through 2013. The article by Etienne Lale concluded that:
“Multiple jobholding declined in the United States during the past two decades [1994-2013]. Data from the Current Population Survey show that the trend reflects a lower propensity to moonlight among single jobholders. Multiple jobholders, by contrast, did not become more likely to return to single jobholding…
In 2013, 6.8 million workers in the United States held more than one job. Twenty years before, the figure was 7.5 million, although the total number of workers with a job was lower by 15.9 million. The multiple-jobholding rate— the proportion of multiple jobholders among all employed workers—rose from 6.2 percent in 1994 to a high of 6.8 percent during the summer of 1995. It has declined steadily since then and was at 5.0 percent by the end of 2013. Inspection of data from the Current Population Survey…reveals that the downward trend holds across various sociodemographic groups of the working-age population (those 16 to 64 years old).“
The above analysis had indeed picked up an apparent downward long-term (20-year, 1994-2013) trend in the rate of multiple jobholding among all workers, male and female, and across different age groups and educational attainment levels. The historical time series also revealed the short-term blips up in multiple jobholding that happened during the Great Recession which caused a temporary deviation or at least pause in the downward trend. This reminds us that people who hold multiple jobs often do so because they need the extra income or because one job alone (whether part- or full-time) doesn’t pay enough to pay one’s bills. Was the general downward trend from 1994-2013 due to more people having access to better-paying jobs because of long-term (not just cyclical) improvements in the economy–such that at least in non-recessionary times we should see continued declines in multiple jobholding?
I decided to take a quick spin through the most recent data available (through July 2019), to split the women from the men, and to look at multiple jobholding as a share of some broader populations–not just as % of employed (as BLS calculates for us in their report), but as % of the labor force and as % of overall population. The charts below show (really simple) annual averages of the unadjusted monthly data for all years from 2000 through 2019 (with 2019 showing the average of only the first 7 months in the year, which I can think of reasons why that would bias the number upward as well as downward).
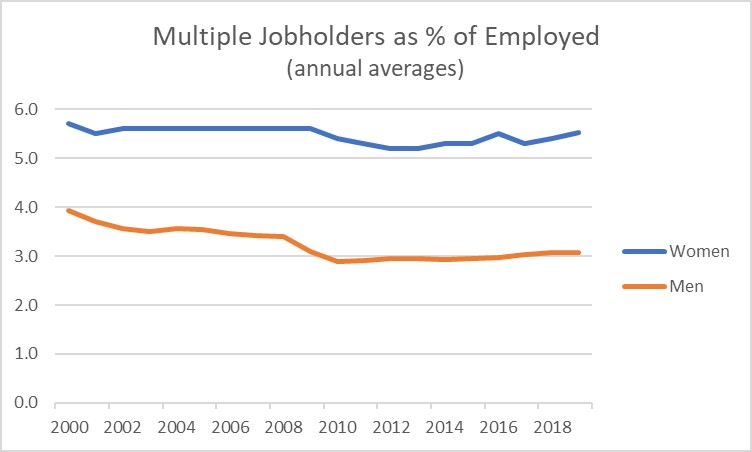
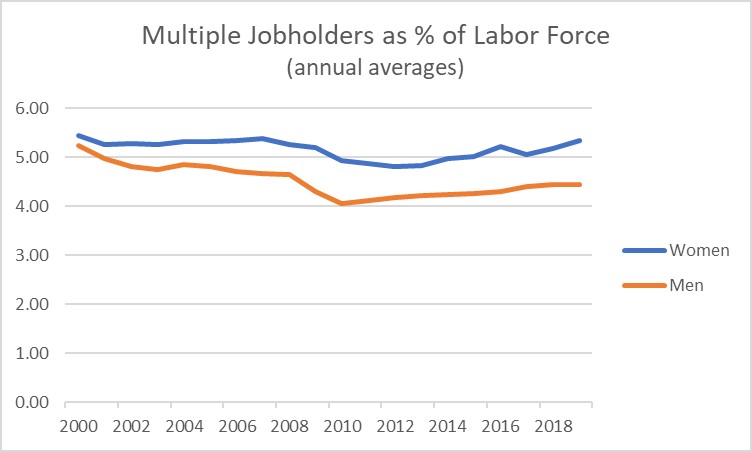
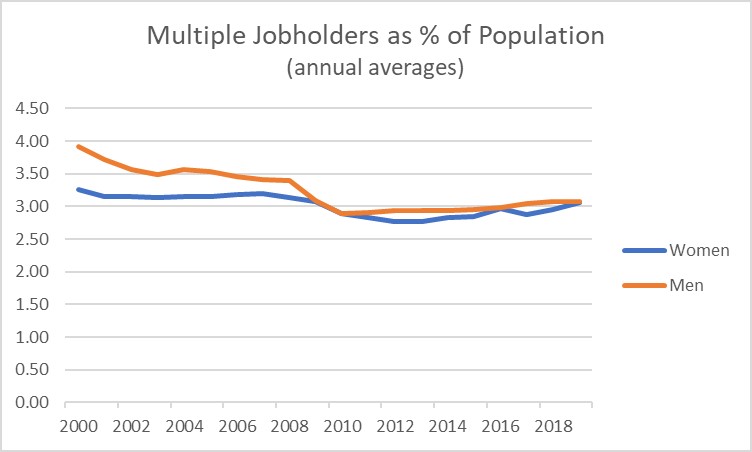
Multiple jobholders as % of employed, annual averages of unadjusted (not seasonally-adjusted) monthly numbers, for employed women (age 16+) and employed men (age 16+), from BLS historical tables in the July 2019 employment report (https://www.bls.gov/cps/cpsatabs.htm).Multiple jobholders as % of labor force, annual averages of unadjusted (not seasonally-adjusted) monthly numbers, for women (age 16+) in the labor force (i.e., employed or unemployed and looking for work) and men (age 16+) in the labor force. Calculated from BLS historical tables in the July 2019 employment report (https://www.bls.gov/cps/cpsatabs.htm).Multiple jobholders as % of population, annual averages of unadjusted (not seasonally-adjusted) monthly numbers, for women (age 16+) and men (age 16+). Calculated from BLS historical tables in the July 2019 employment report (https://www.bls.gov/cps/cpsatabs.htm).
You can see why I titled this post “Women Work A Lot of Jobs”–because the difference between the story for men and the story for women is stark. In the 2015 article cited above, it was already apparent that multiple jobholding was more common for women than for men; since the late 1990s the fraction of employed women working multiple jobs has always exceeded–and increasingly so–the fraction of employed men working multiple jobs. The longer-term downward trend in multiple jobholding that first started in the late 1990s for both women and men appears to have bottomed out after the Great Recession and even started to rise again–a new trend that was hard to spot in the prior analysis that went only through 2013. For women in particular, something about the current economic expansion and whatever the “new normal” might be is causing multiple job holding to be a more common state. As of July 2019, 5.7% of employed women (age 16+) and 5.5% of women in the labor force were multiple jobholders–both the highest monthly shares since 2009 (when the overall unemployment rate hit 10%)! And from the last % of population chart, this says that any woman is now as likely to be a multiple jobholder as any man–regardless of whether they are in the labor market or not! (3.16% of total population for women and 3.25% for men as of July 2019; the chart shows only annual averages.) And that’s multiple jobs in the formal labor market–not even counting all the jobs we do at home before and after “work.”
Why is this happening to women–so differently from men? I can make up several different explanations (below), none of which could be confirmed or rejected without further breakdowns (“crosstabs”) of the data–such as women by age, educational attainment, and marital status–and/or (ideally, and) by conducting survey and focus group research on women vs. men who work multiple jobs and asking them “why?”
They need multiple jobs to add up to the pay of one job. Women are more likely to earn less than men in even a main, full-time job, holding constant their level of human capital (such as holding a Ph.D. in economics), for all the different reasons that could fill up an entire book: career interruptions having children, having more responsibility in caring for (young or old) family members, being less inclined to ask for raises and promotions, as well as outright (unfair) discrimination.
They need multiple jobs because their best single job opportunity would still leave them underemployed. Many women reentering the workforce after raising children may find it hard to get hired into a full-time role after so much time out of the labor market. They may also choose to intentionally signal to employers that they need some flexibility in their schedule to attend to their family when needed. This gives the employer an excuse to underpay and underemploy them. (Women who reveal they are not only mothers but also wives receive the double whammy of signaling that they don’t need a full-time job because they have a spouse to support them. Economists know this result from recent research showing the effects of the birth of a child on a father’s vs. a mother’s earnings.)
They choose to work multiple jobs not because of the money but because of how they want to spend their time and use their talents. I recently got remarried, and it kills me when women say “congratulations, you don’t have to work anymore!” (Men wouldn’t dare say that to me.) I’ve always worked multiple jobs even while having one really good full-time job, because I like doing things other than my main job, and sometimes I even get paid a little for those other things (like teaching economics one evening a week and teaching yoga on Saturday mornings). Did you know that women 55 and over are projected to be the single fastest growing segment of the labor force over the next decade? Many of us have high levels of human capital and have had productive careers thus far, but now that the kids are grown, we have more time and energy and wisdom and can actually work harder in the market economy than ever before–but we can also afford to be choosy about how we work, and often a combination of part-time roles that are customized to our skill sets and talents will be more attractive to us than one full-time, cookie-cutter role (which maybe any old man or younger person could fill).
So the phenomenon of holding more than one job is definitely not a thing of the past. It’s also not a thing that necessarily gets worse/more prevalent during recessionary times, given that its rates as a share of whatever denominator you use–employed, labor force, or total population–are as high now as during the Great Recession. It’s also not easy to blanket-characterize as a bad thing (forced by economic hardship) or a good thing (more opportunities to be productive in more ways). I think it’s a great example of something important happening in our economy which to better understand, we need to do more quantitative and qualitative research on–by analyzing more disaggregated (“granular”) data, and by having conversations with more individual people (those grains in granular!) who I know will have stories to tell, because I do, too.