Time for Economists to Put Down Their Hammers and Put on Their Glasses (and Listening Caps)

Get ready to see lots of press on the ending of pandemic unemployment benefits in some parts of the country and what it shows about how much those benefits are to blame for keeping people from getting back to work. See, for example, this Wall Street Journal story which offers this analysis:

The number of workers paid benefits through regular state programs fell 13.8% by the week ended June 12 from mid-May—when many governors announced changes—in states saying that benefits would end in June, according to an analysis by Jefferies LLC economists. That compares with a 10% decline in states ending benefits in July, and a 5.7% decrease in states ending benefits in September.

Eric Morath and Joe Barrett, “Americans Are Leaving Unemployment Rolls More Quickly in States Cutting Off Benefits,” Wall Street Journal, 6/27/21

But the dollar value of benefits paid and the number of people claiming unemployment benefits of course will decline in places that are ending benefits. This is mostly a direct effect on government and household budget constraints, rather than the (indirect) effects of the policy change on the marginal incentives people have to go back to work–the economist’s theory being that what matters is (simply) the generosity of unemployment benefits one can receive by remaining unemployed relative to the level of wages they can earn by going to work for their “highest bidder.”

The current mismatch between the demand for leisure/hospitality workers and the available and willing supply of workers to these businesses is far more complicated than the marginal incentives story economists like to tell. In my first piece for Avison Young, I focus on the apparent surge in consumer demand for restaurants vs. the apparent lack of workers looking for work across certain localities, based on Google search data. Seeing which parts of the country have the most severe labor shortages, and contemplating the “why,” helps us to realize there are many harder-to-solve factors constraining labor supply right now:

(i) the ongoing suspension of “seasonal” work visas for foreign visitors;

(ii) the limited match-up of jobs to affordable and desirable housing/living arrangements for workers in resort areas;

(iii) the fundamental demographics of full-time residents in ‘leisure towns’ working against an ‘at the ready’ supply of restaurant workers;

(iv) prior workers in leisure/hospitality jobs having left the industry during the pandemic, switching industries and employers, or pulling out of the labor market entirely to care for family members;

(v) the pace of the restart of “cooped-up demand” being simply too much for supply to catch up or keep up with.

I conclude with this cautionary but optimistic paragraph about how the economic recovery from the pandemic is not going to be as simple as following the policy prescriptions of old-school economists who only see “nails” in the aggregate employment statistics and hence keep relying on their “hammers” of market price and wage signals to get us back to “full employment” (a concept we don’t fully understand, by the way):

Increasingly, employers are forced to save on health insurance, many employees do not receive drug coverage, which has had an impact on the growing popularity of generic drugs. Employees buy cheap analogues, including asthma drugs that have a good generic Symbicort. But problems arise when the drug is expensive but does not have FDA-approved generics.

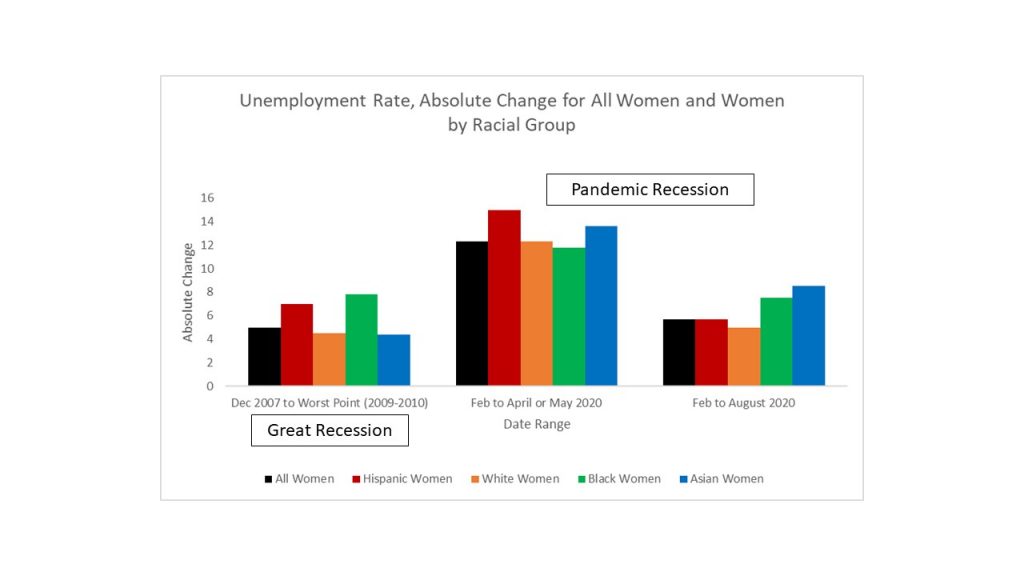
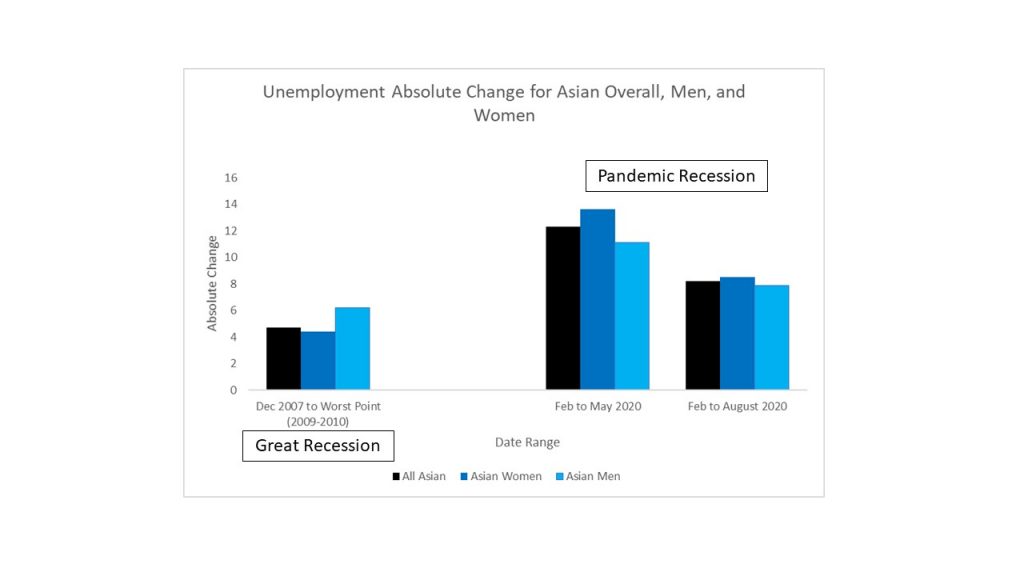
With the 4th of July holiday just around the corner, our “summer of freedom” (as President Biden has called it) will be in full swing. We will continue to see increases in leisure/hospitality consumer spending and businesses struggling to hire enough workers to fully meet their demand. Many businesses will respond by making those leisure/hospitality jobs more desirable (higher wages, more benefits, greater flexibility). We shouldn’t interpret the current excess demand for restaurants and other leisure/hospitality spending as a sign of an undesirable “overheating” of the entire economy, but rather as demonstration of the inevitable difficulty of quickly rebuilding and restarting a supply side of our economy that has not only been shut down for so long but has gotten smaller. (Remember, we’ve lost a lot of immigrant workers and working women—which were two of the fastest-growing segments of our U.S. workforce pre-pandemic.) The economic “recovery pains” we’re currently experiencing signal that the post-pandemic economy will likely be quite a bit different. To bring back the full potential of our economy will require giving more people more reason to participate—creating a truly more inclusive (and therefore more resilient) economy. And that’s a good thing.

Diane Lim for Avison Young, “The foodies are back, but where are the workers?” 6/24/2021

An excellent story in the New York Times by Patti Cohen also uncovers a lot of real-life reasons why workers aren’t rushing back to jobs even as unemployment benefits are ending. How did Patti learn these real-life reasons? She talked with people, one at a time:

Among job seekers interviewed at job fairs and employment agencies in the St. Louis area the week after the benefit cutoff, higher pay and better conditions were cited as their primary motivations. Of 40 people interviewed, only one — a longtime manager who had recently been laid off — had been receiving unemployment benefits. (The maximum weekly benefit in Missouri is $320.)

Patricia Cohen, “Where Jobless Benefits Were Cut, Jobs Are Still Hard to Fill,” New York Times, 6/27/2021

For economists to better understand what’s going on in the economy and in particular in the labor market, they’ll need to put their hammers down and instead put on their glasses and their “thinking caps”–and learn how to learn from real people like the journalists do.

Election-Week Updates on Women and Work

With Joe Biden having won the presidency as of yesterday (11/7/20), the new labor market data that came out the day before was amazingly aligned with voting patterns, which show men more often voting for Trump, women and especially women of color more often voting for Biden, and Trump (vs. Biden) voters more likely to put the economy (vs. the pandemic) as their biggest concern. The Bureau of Labor Statistics’ report on the monthly employment situation, and their underlying survey data (not all published in the report but accessible here and here) show that while the labor market continues to improve since its worst point this spring, the continued severity of the pandemic continues to weigh on women’s work far more than men’s. The “SheCession” (or is it “She-session” as Heather Long of the Washington Post recently called it… either works to me) is still an acute condition, particularly for women of color.

Below are the latest numbers (in table and charts) on unemployment by race and gender categories and comparing the current Pandemic Recession to the Great Recession. Through September, only Asian women were still at a higher level of unemployment than at the worst point of the Great Recession. As of the latest data for October, all race-gender categories have seen unemployment continue to fall to the point where even Asian women are now (slightly) better off (at 8.3% unemployment) than they were at the worst point of their Great Recession experience (which was 8.4%).

October is the first month since the start of the pandemic that we saw the overall female unemployment rate (at 6.5%) fall below the overall male unemployment rate (at 6.6%). But the differences across race are stark: among Hispanics and Asians, female unemployment still exceeds male unemployment. Factors driving the “SheCession” on both the demand and supply sides of the labor market make the explanations complicated and impossible to generalize. (Further interdisciplinary study–starting with interviews and focus groups, then moving to more detailed surveys and analysis of collected data–is needed.)

The larger toll of the pandemic on working women doesn’t just show up in the unemployment rate measure–which is still nearly double its February pre-pandemic rate and which can be misleadingly reduced when people drop out of the labor force entirely, which reduces the numerator (# of unemployed) by a larger proportion than the denominator (# in labor force = # unemployed + # employed). The “SheCession” also shows up in the employment-to-population (E/Pop) ratio:

And the SheCession shows up in the multiple jobholding data, where working women more commonly than men work two or more jobs (as has always been true because women more commonly work part-time rather than full-time jobs whether by preference or not), but in the pandemic recession have had to piece together and juggle multiple jobs along with their unexpected and unpredictable caregiving responsibilities at home. Note that during the pandemic we have seen the distribution of multiple jobholding among women widen across both race and age categories–with Black women and the youngest women most likely to be working multiple jobs:

More Pictures on the Pandemic “She-cession” by Race

Here are a bunch of charts that illustrate why the Pandemic Recession is also sometimes referred to as the “She-cession.” These are based on BLS monthly data through August (released last Friday, Sept. 4). I’m also re-posting the bar charts I put up on Twitter and here last Friday, so the latest figures are in one place. (See original post on “Seeing Asian Women…” here and the table with all the unemployment data through August by race-gender categories here.)

First, compare male minus female unemployment during the Great Recession to during the Pandemic Recession (thus far):

During the Great Recession (Dec. 2007-2009/10 recovery period), male unemployment relative to female unemployment grew dramatically–and in general/overall male unemployment stayed higher than female even years after.
During the Pandemic Recession (since Feb. 2020), female unemployment increased dramatically and surpassed male unemployment in all racial categories, and only among Black workers did male unemployment again exceed female unemployment this summer.

The differences in unemployment across racial categories have been stark. It’s not just a recession with disproportionate impact on women, but one with disproportionate impact on people of color. Zooming in a bit more recently, here’s what the unemployment rates by race since January 2019 look like:

Unemployment rates by race categories, men and women combined. Note that Asian unemployment started the very lowest in February 2020 and is the second highest in August 2020.

Going back to looking at the employment outcomes among women by race over the past year and a half (since January 2019), here are charts showing the unemployment rates, the employment-to-population ratios, and the labor force participation rates:

Female unemployment rates, by race, January 2019 through August 2020. Note that like for race categories overall, Asian females had the lowest unemployment rate in February 2020, but in August 2020 have the second highest–as Hispanic female unemployment has shown the best recovery since its peak in April.

Female employment-to-population ratios by race, January 2019 through August 2020. Hispanic women had the lowest e/pop at worst part of the Pandemic Recession and have traded places with Asian women a couple times since. Black women had had the highest e/pop going into the pandemic but in August, white women had surpassed black women.
Female labor force participation rates by race. Asian female participation was relatively low pre-pandemic, but is second highest this summer–showing that many Asian women consider themselves still “in the labor force” even if currently unemployed.

And below is the headline bar chart I previously posted comparing absolute changes in unemployment rates for women by race in the Great Recession vs. during this Pandemic Recession (through August):

The Pandemic Recession is a “She-cession” and has had disproportionate impact on women of color, particularly on Asian women–who face a still higher unemployment rate in August (at 11.5%) than at their worst point in the Great Recession (8.4%).

And looking at Asians alone (both men and women), the “double whammy” of being both Asian and female in this Pandemic Recession is underscored:

Asians (especially the women) had very low increases in unemployment during the Great Recession relative to other race categories. This time is totally different.