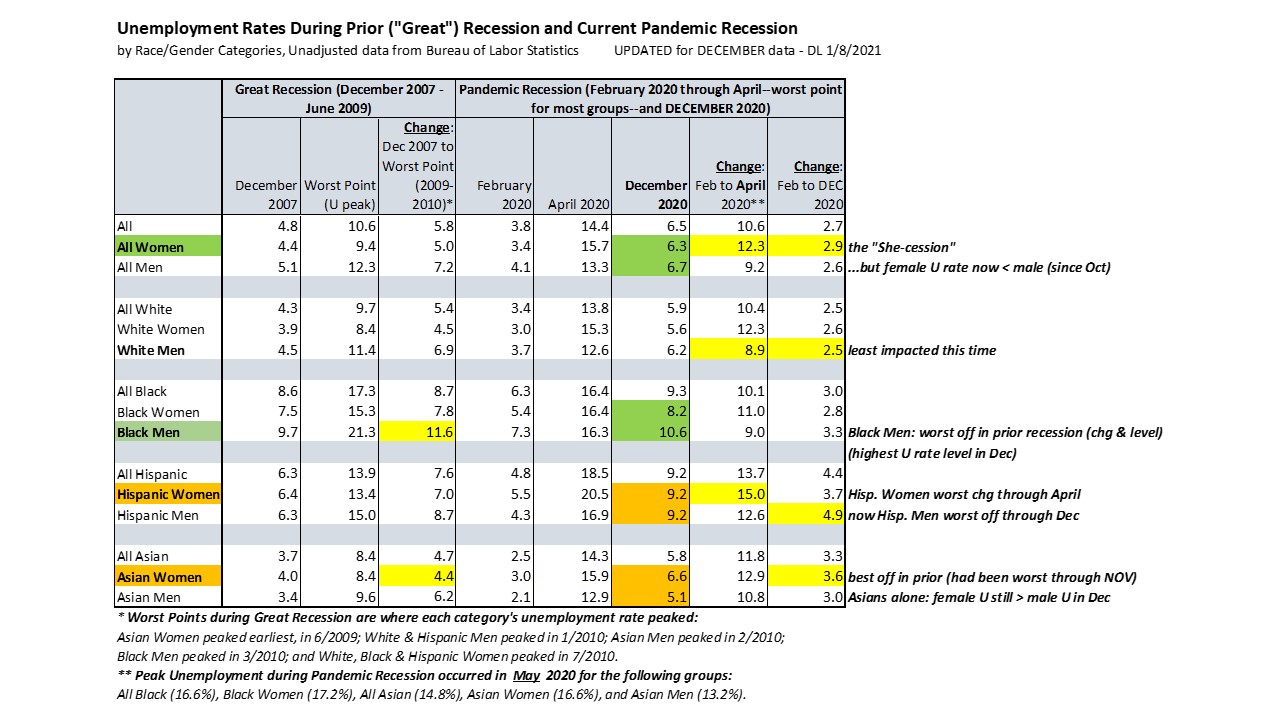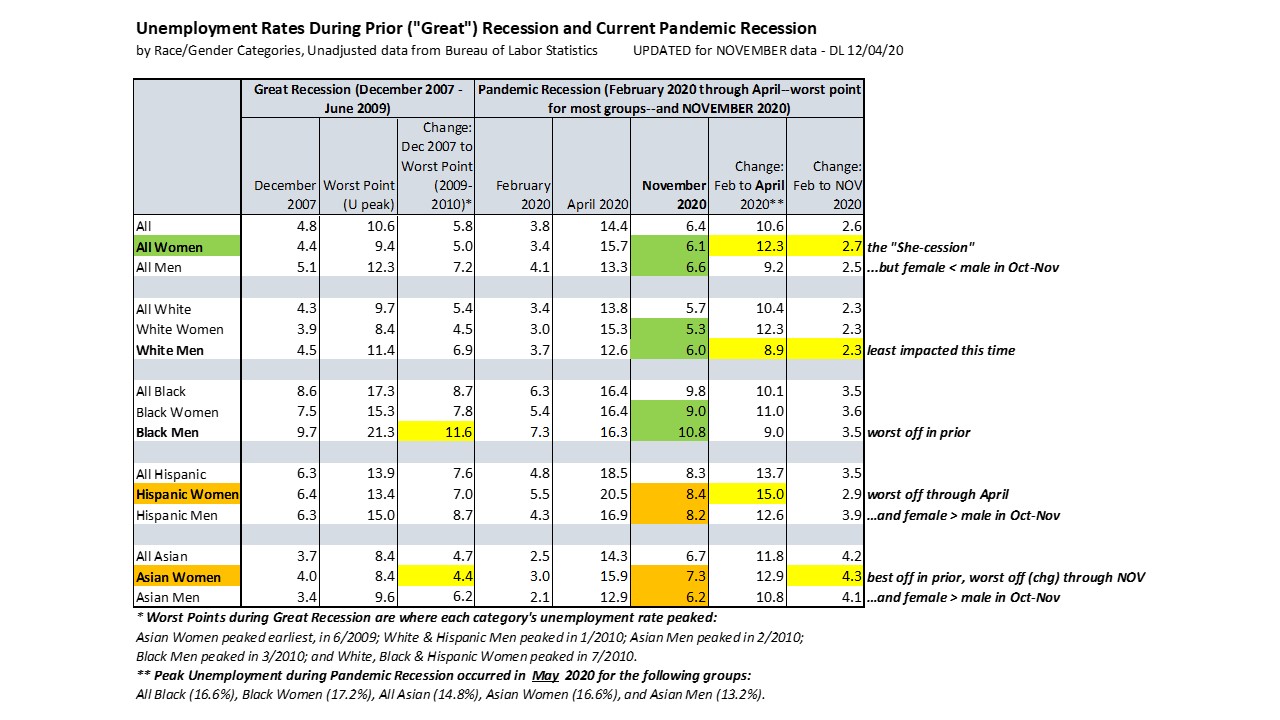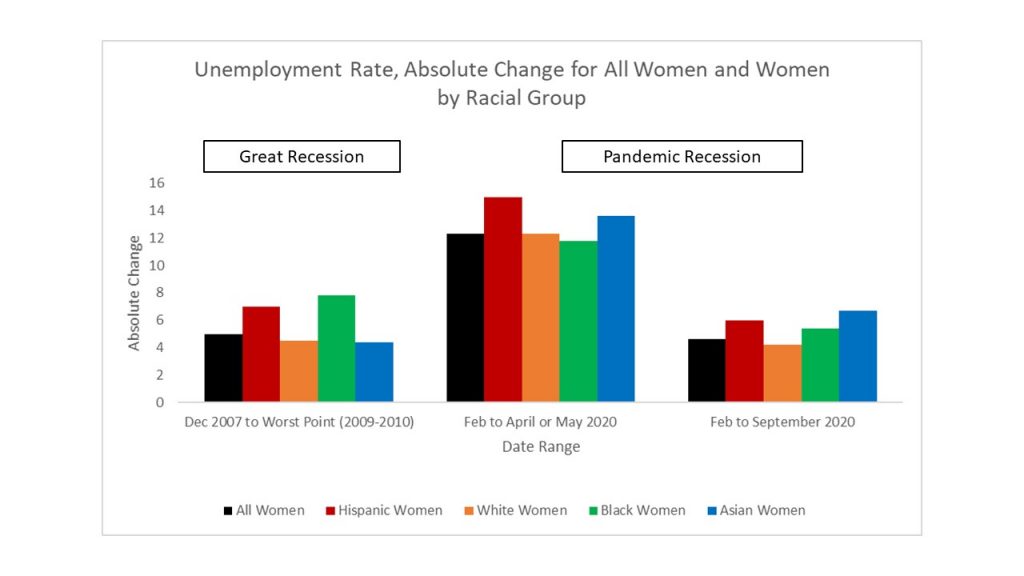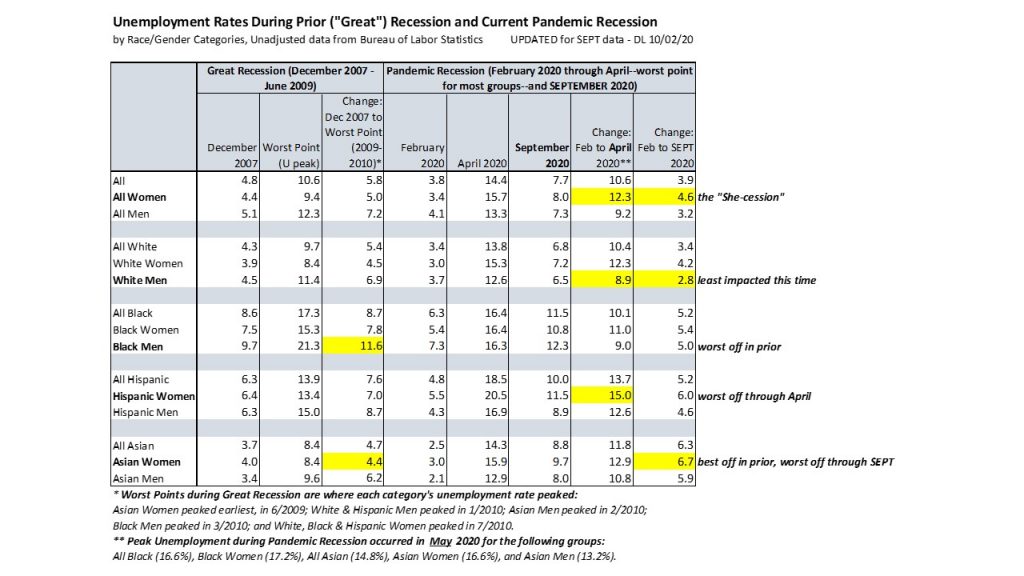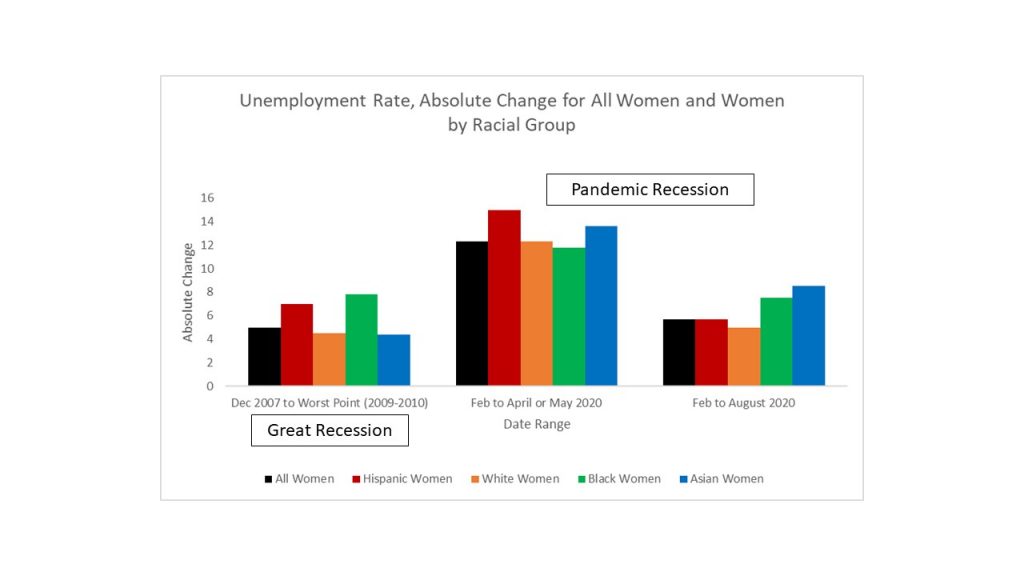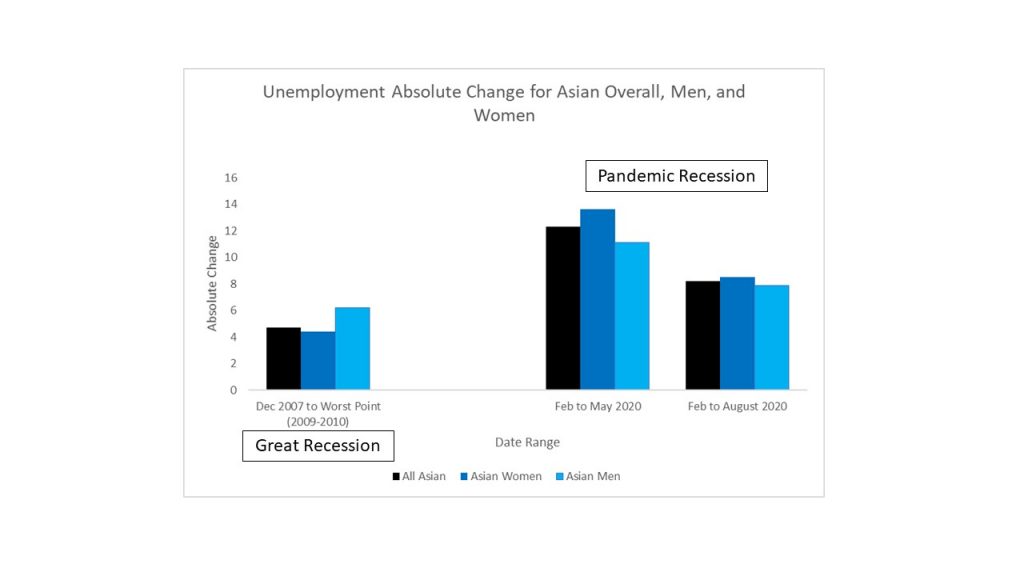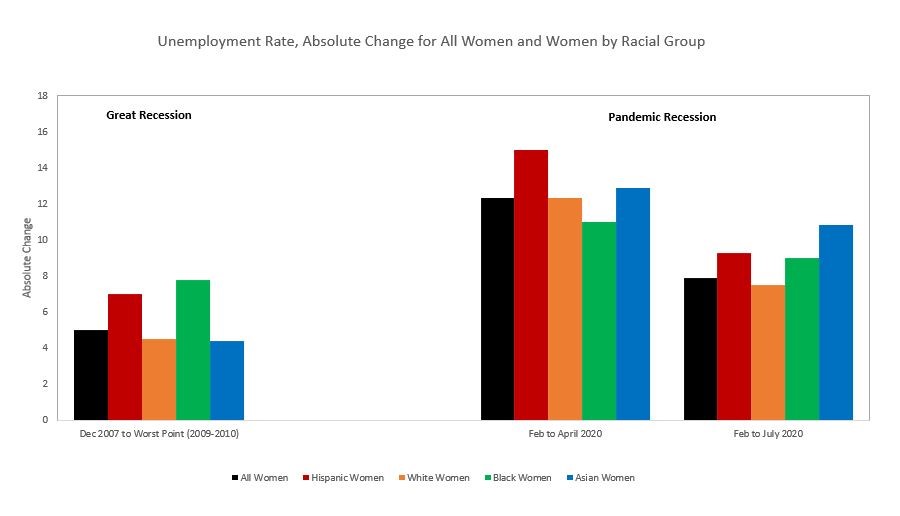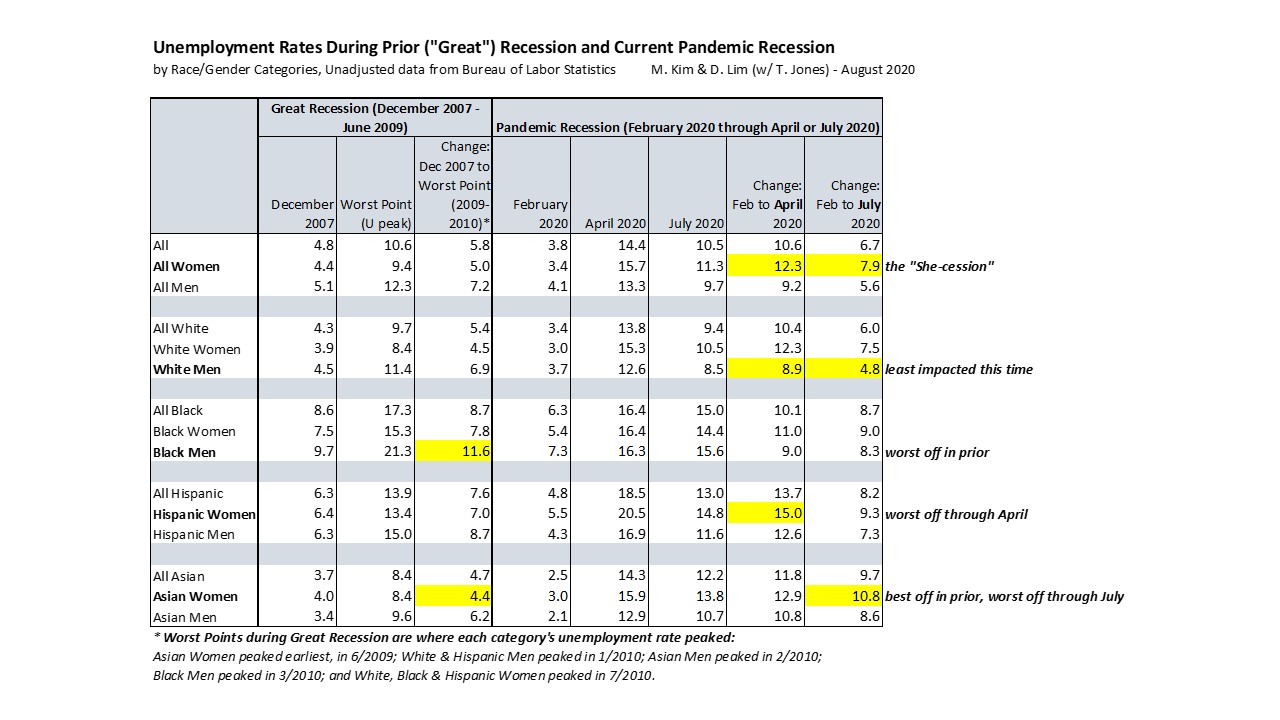
It was back in August 2020 that Mina Kim and I first started looking at the (kinda-secret yet publicly-available) Bureau of Labor Statistics data on Asian female employment status and noticed that the Asian female pictures were like holding a magnifying glass to the more general stories documenting the so-called “She-Cession.” It turns out that the one race-and-gender category with the largest absolute increases in unemployment for several months from July through November were Asian women. I continued to track the data releases each month (not always remembering to update my blog I now realize, but always sharing on Twitter). I saw the overall female unemployment rate finally drop back below the male one back in October, while the Asian female unemployment rate has remained higher than the Asian male one even through last Friday’s data release for February 2021.
Now, employment status is a notoriously imprecise thing to measure, and responding to a short survey question with a short, categorical answer about something as complicated as what kind of work you’re doing during the pandemic is difficult. I know, because over the summer I got surveyed by the Census Bureau’s “household pulse survey” and was often not sure which answer to pick and wanted to add “but let me explain…” I had taken a buyout/severance package offer from my last full-time job, so I was not working that job anymore but was continuing to get paid (for another month or two at the time, at least). While the “loss” of my job was of my own doing, at the same time it certainly felt like it was a pandemic-related job loss that certainly hadn’t been completely my choice, and my lack of success in finding a new full-time role really made me feel like a legitimately involuntarily (and now long-term) unemployed person.
I started to imagine how many other people struggle to respond to those household surveys, maybe get confused about the different labels for employment status, maybe get worn out by the end of the questions and start answering without careful thought. This, of course, is the challenge of collecting data through fielded surveys, rather than letting people self-report what’s on their minds based on their Google searches or their other means of asking for help and interacting and transacting with the world.
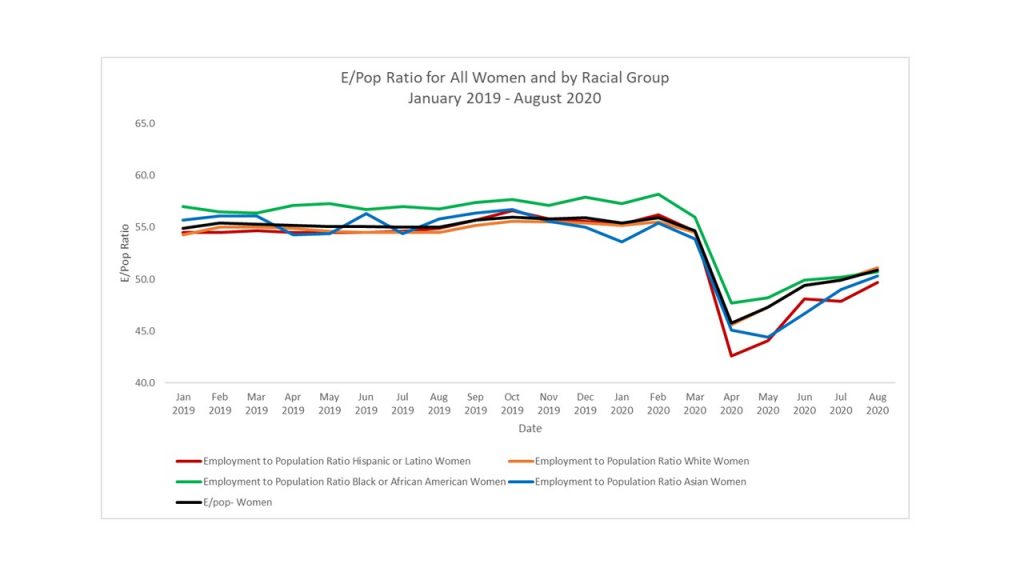
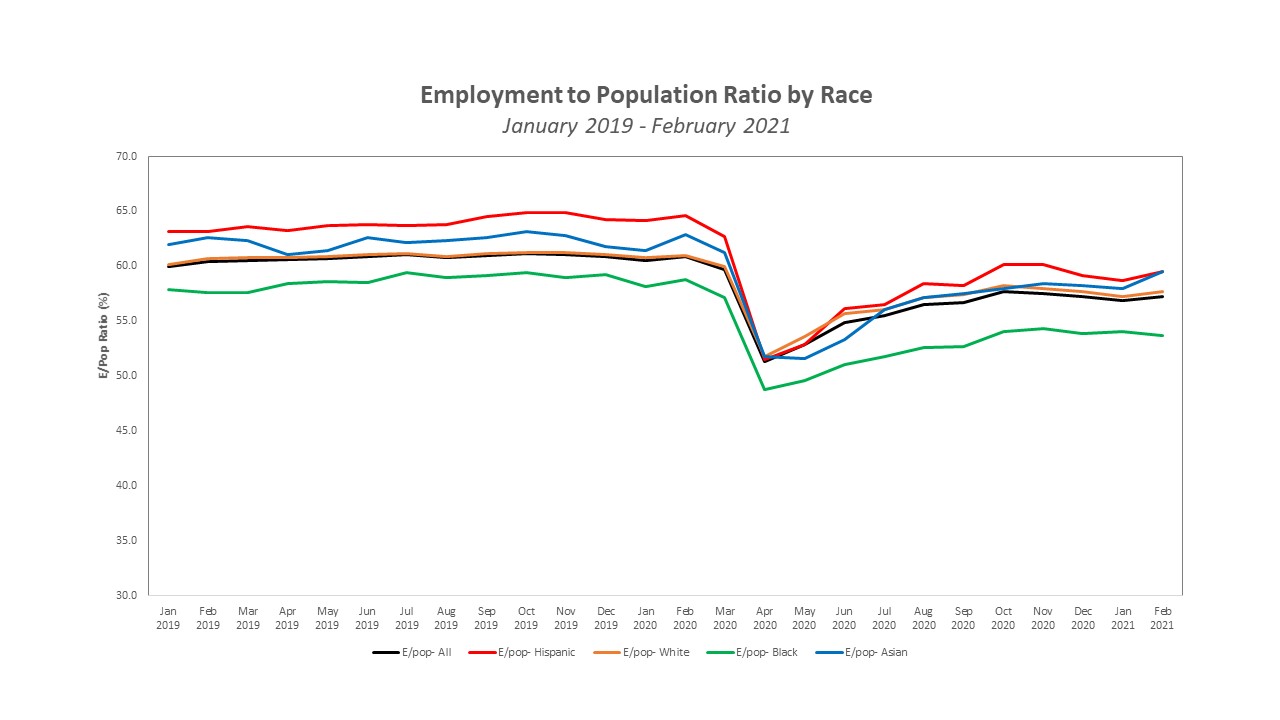
But the BLS data remain the best data we have to study what’s going on with US employment, so that’s what I’ve been sticking with (while urging agencies and research organizations to expand efforts to collect more disaggregated data to better understand the macroeconomy as well as the disparities that aggregate and average statistics hide, per one of President Biden’s Day One executive orders). Now that a full year has passed since the economic starting point of the “pandemic recession” (the last employment peak in February 2020), I’ll put aside the more erratic unemployment story and the messiness of defining “labor force participation” (which also defines the denominator of the unemployment rate) and focus on the cleaner picture of the employment-to-population ratio.
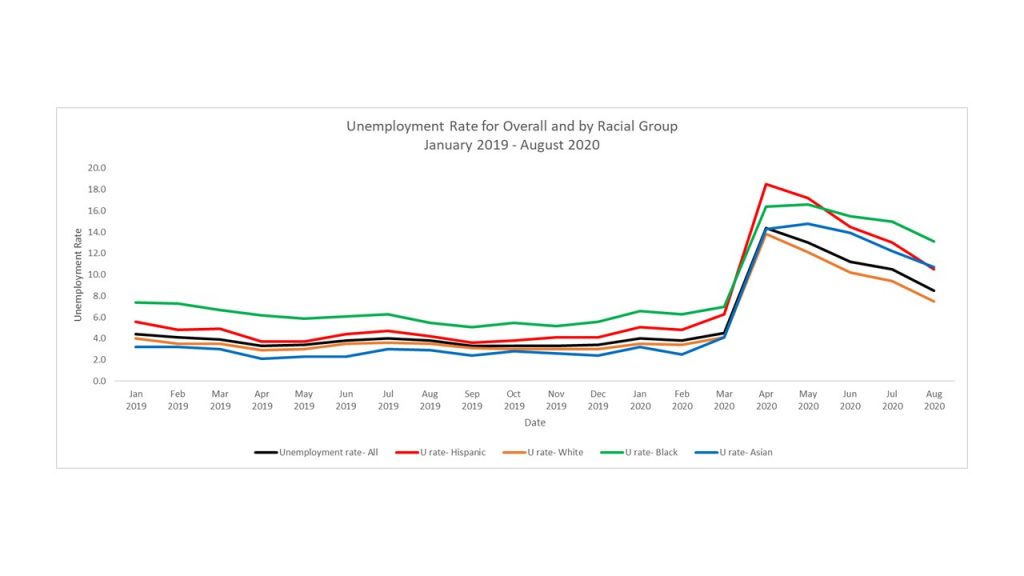
Here are some charts that go back to January 2019 to get a bit of a running start so you see what “normal times” looked like in terms of employment-to-population. I first separate by race, then by gender, then by race *and* gender –to make the point that each way of cutting that data reveals a pattern you couldn’t see in the others.
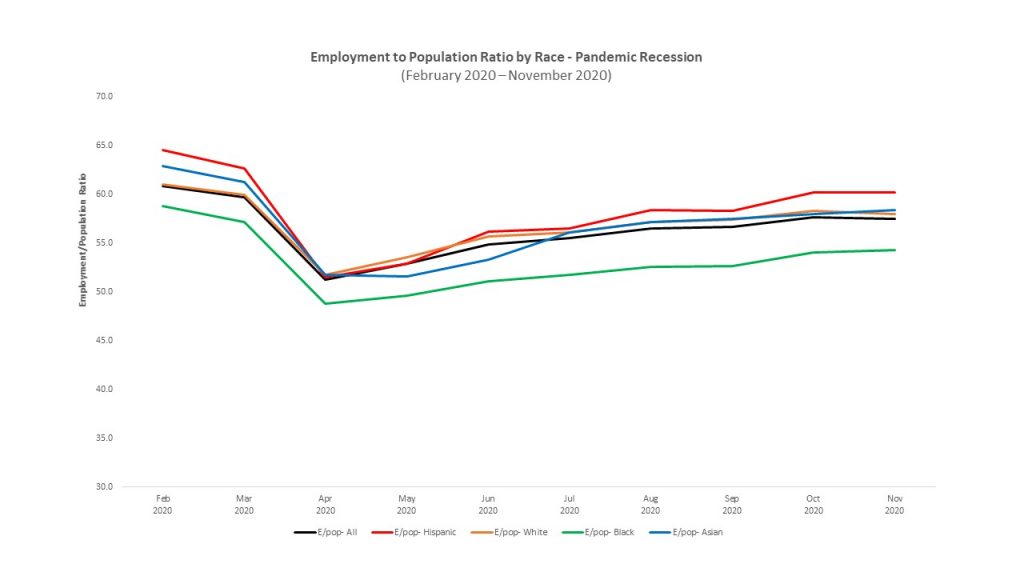
First, by race:
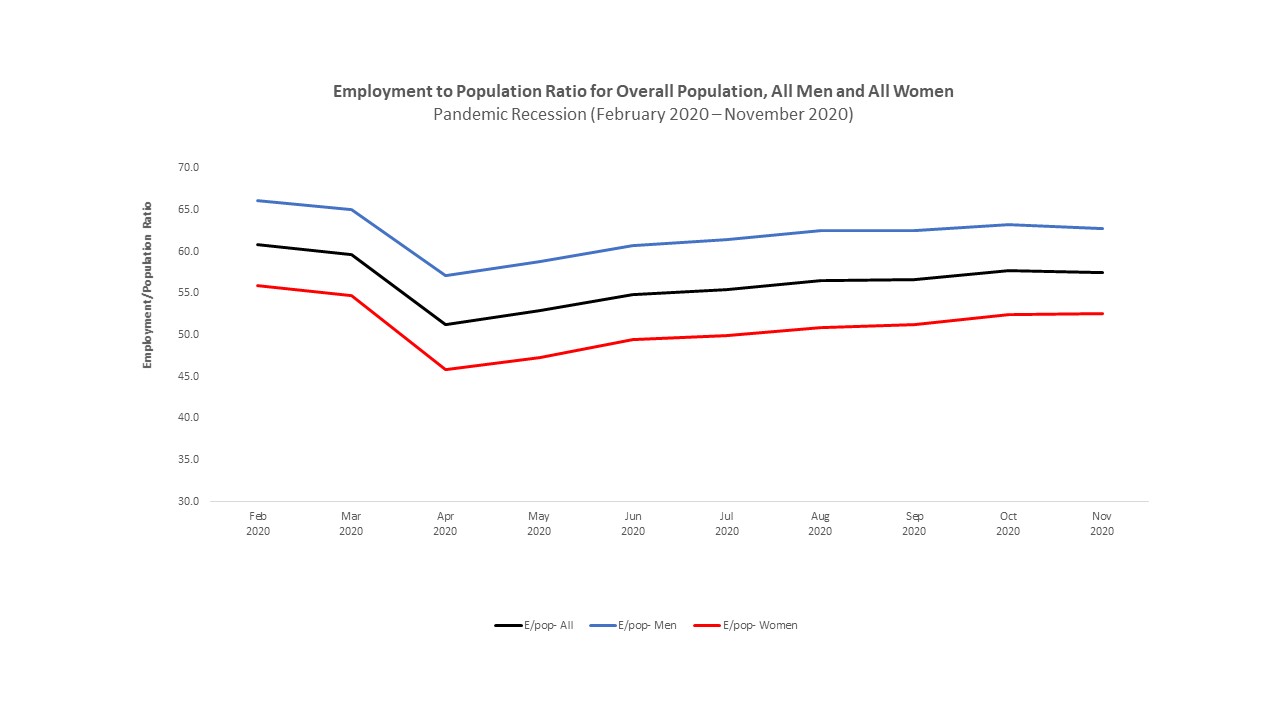
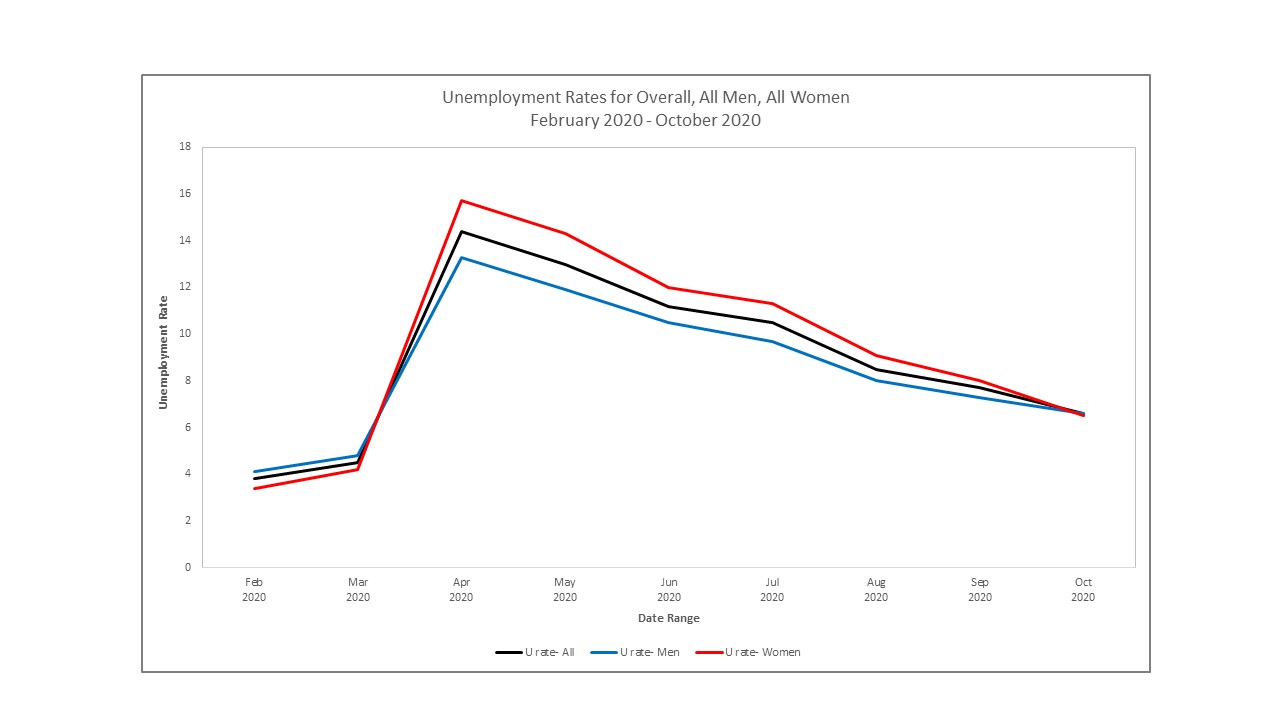
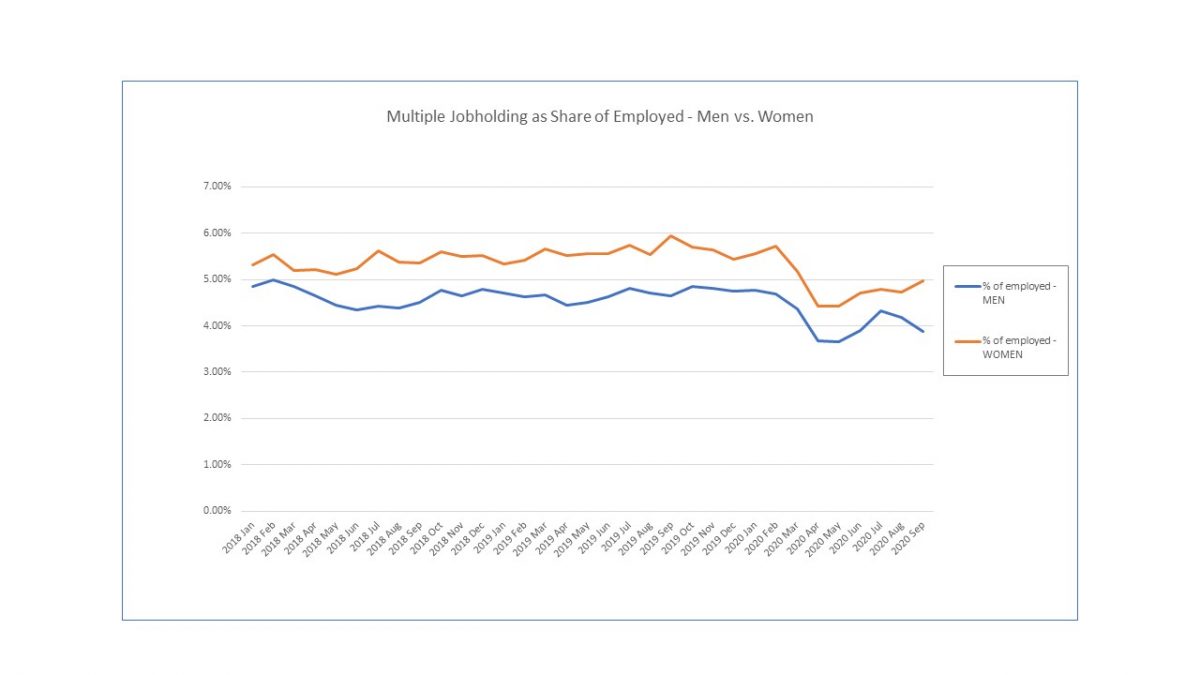
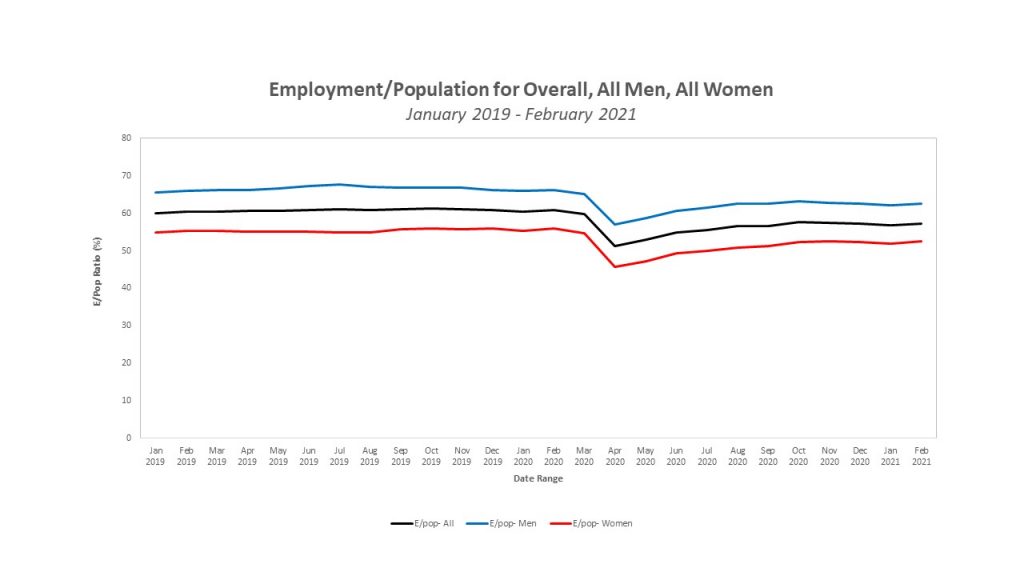
Next, by gender:
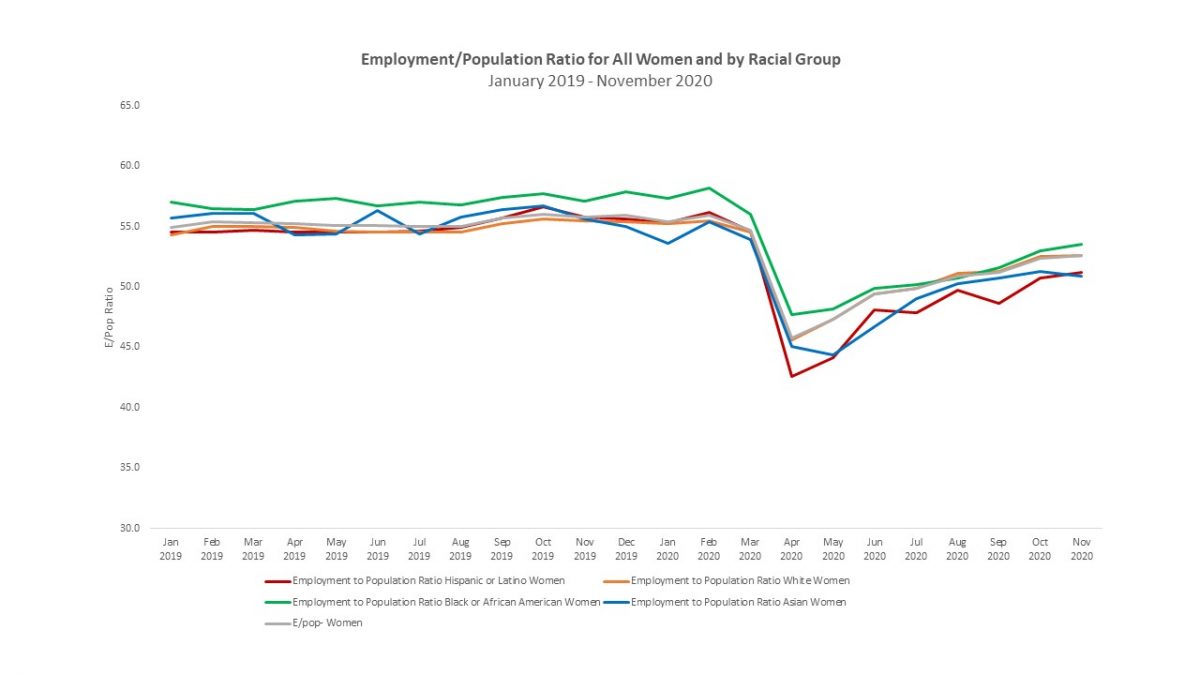
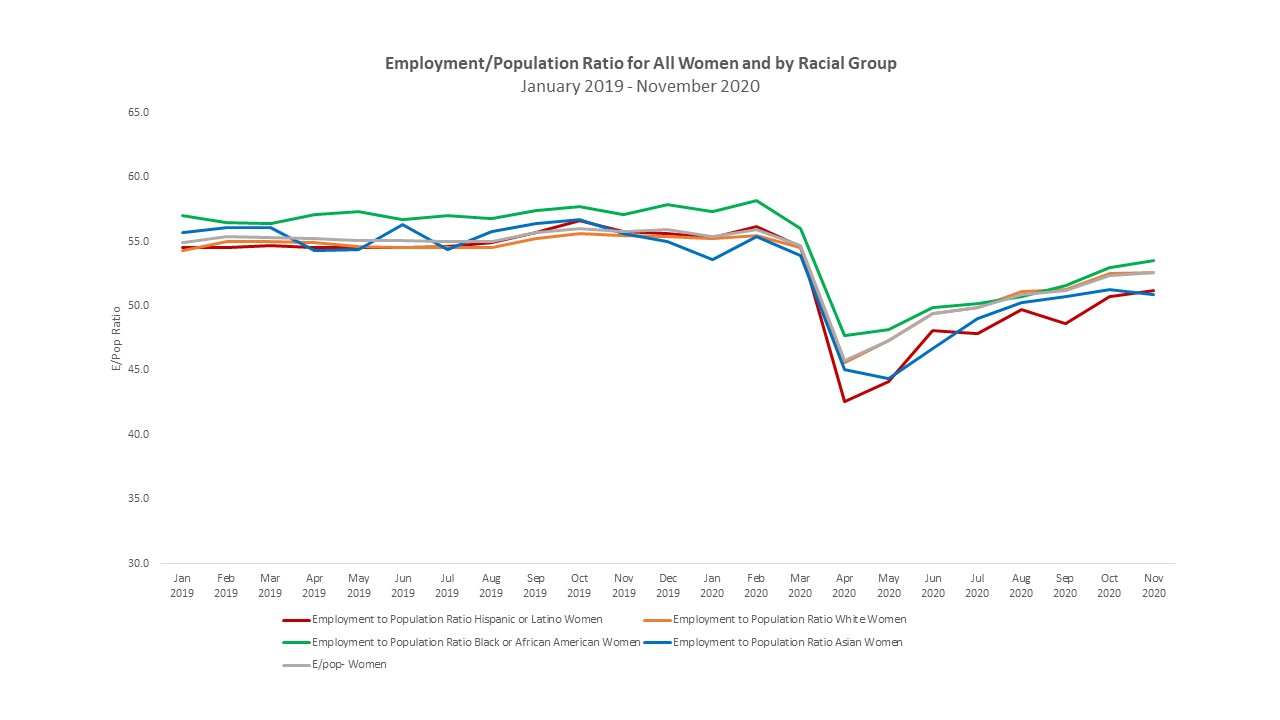
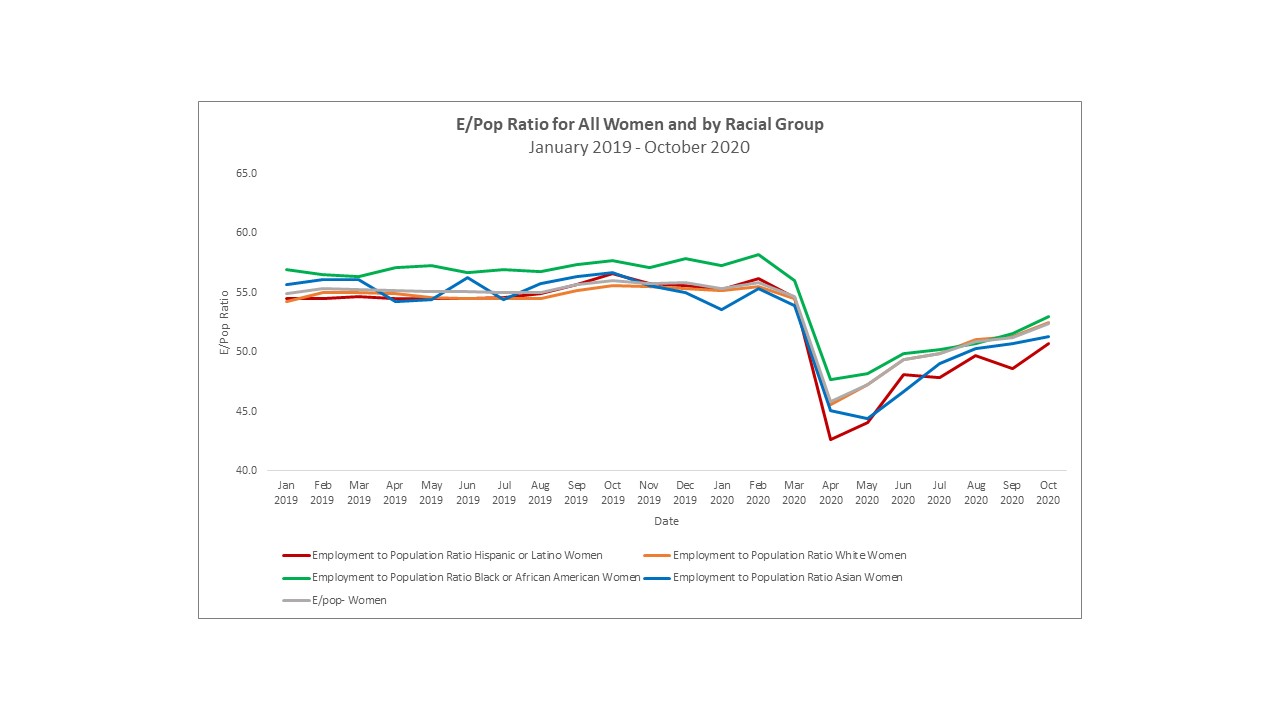
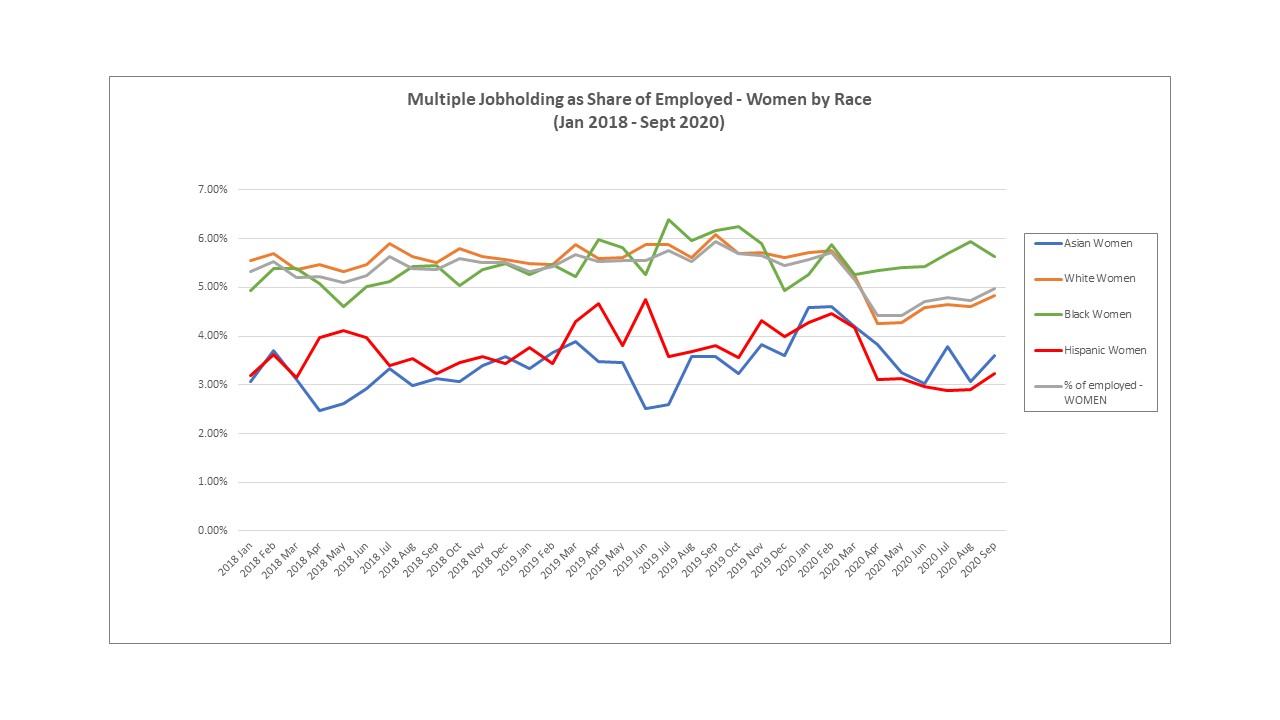
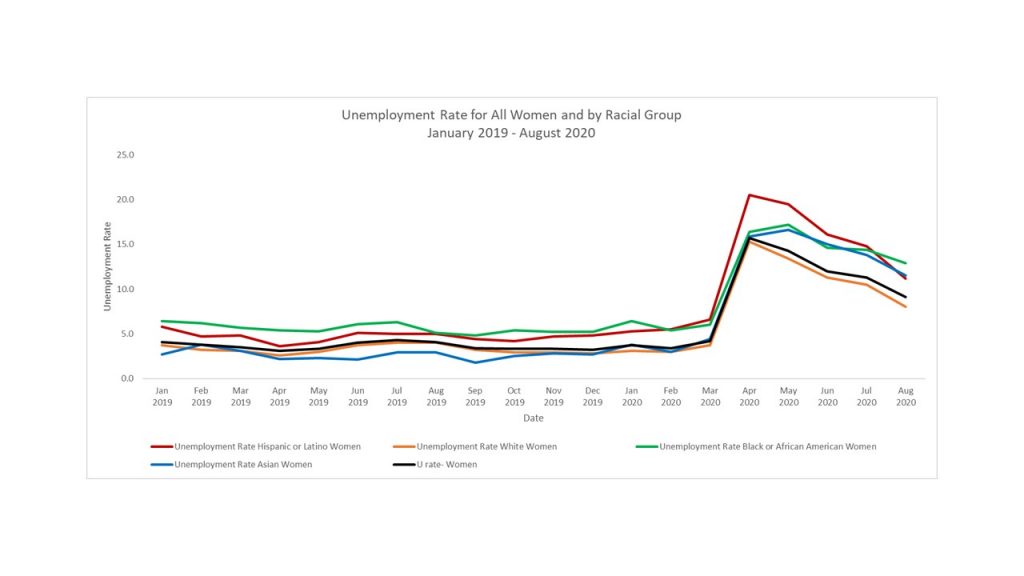
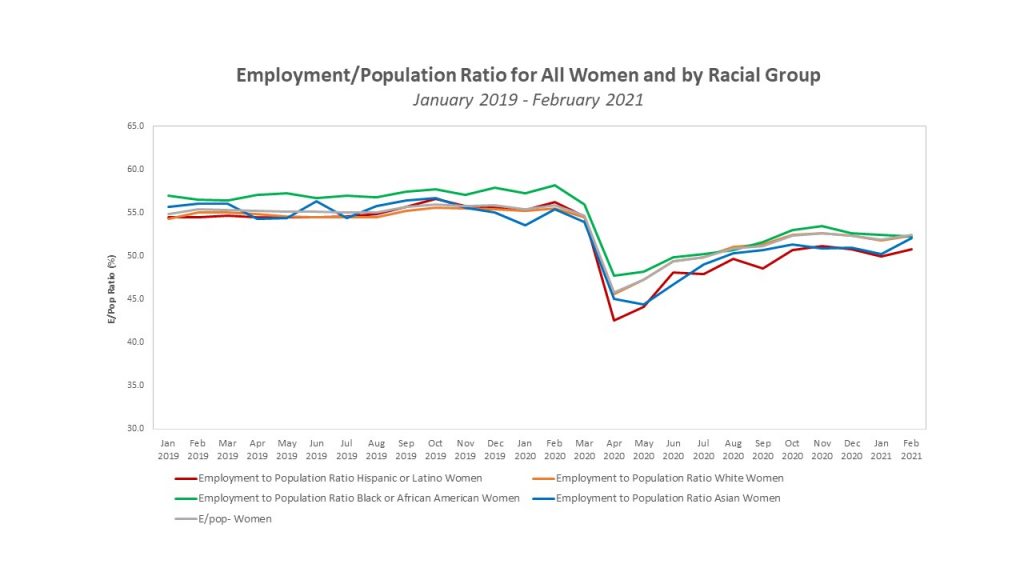
And now, women by race:
And now, men by race:
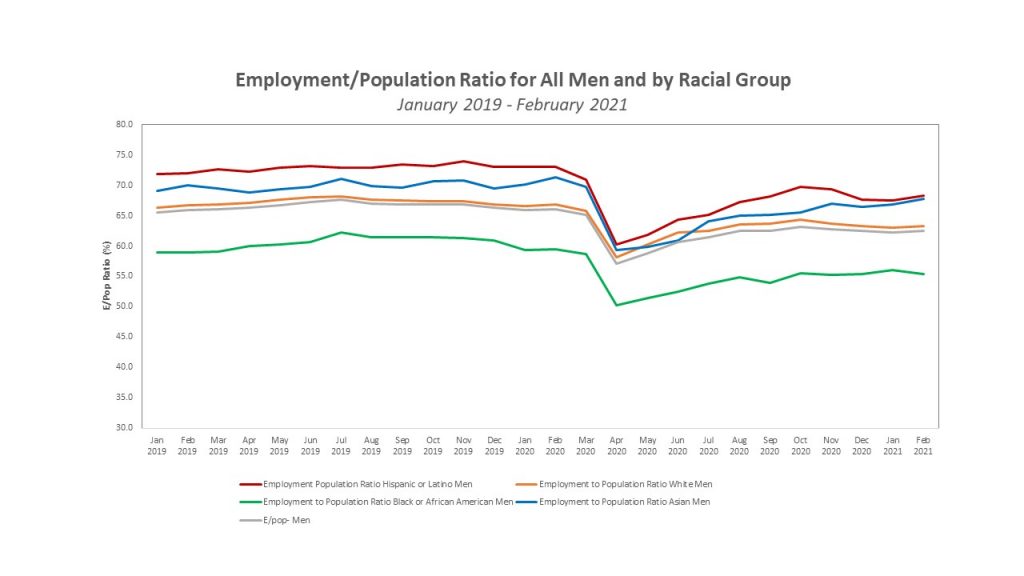
The last two charts showing E/pop for women by race vs. men by race make obvious that gender plays a different role in employment status depending on one’s race. Hispanic and Asian women are less likely to be in paid employment than other women, while Hispanic and Asian men are more likely to be in paid employment than other men. If you look at Census data on the composition of households by race, it shows that Hispanic and Asian households are more likely to be opposite-sex married couples with children. This suggests cultural explanations for the gendered roles of women vs. men in providing household work and caregiving vs. working in the labor market.
You can go back to my August blog with Mina to see more about what we believe makes Asian women “different” from other women. On top of being raised by our immigrant mothers to do everything well (to pursue lots of education and succeed in our careers but be ever-attentive mothers), Asian women also tend to be more cautious about health and safety (and our behaviors/practices during something like a public health pandemic–just think about who were the only people you would occasionally see wearing face masks pre-pandemic?) and more “picky” (discriminating) about the quality of our children’s experiences and education. This explanation is supported by this recent Washington Post story about Asian families being slowest to send their kids back to in-person school:
As school buildings start to reopen, Asian and Asian American families are choosing to keep their children learning from home at disproportionately high rates. They say they are worried about elderly parents in cramped, multigenerational households, distrustful of promised safety measures and afraid their children will face racist harassment at school. On the flip side, some are pleased with online learning and see no reason to risk the health of their family.
By Moriah Balingit, Hannah Natanson and Yutao Chen in the Washington Post, March 4, 2021.
If Asian Americans are such a small fraction of the US population that the government statistical agencies don’t even collect enough data on them to get a statistically-reliable sample (for statistical weighting and seasonal adjustment purposes), then why should researchers and policymakers care about them? Well, Asians are the single fastest growing racial category in the US today. Asian women are the closest to closing the gender pay gap with White men among all women. Asians work disproportionately in the sectors of our economy that were growing the fastest pre-pandemic–sectors like leisure/hospitality, healthcare, and computer science/data analytics. Asian Americans, in other words, have been on the leading edge of movement in our economy–the most influential population in terms of the dynamics of the US macroeconomy. Study what’s going on with Asian women and Asian men at the most granular level you can, and you will better understand how our entire macroeconomy is doing and how to improve public policies and business practices to truly get our economy to close the potential “output gap” –which honestly we do not yet know how to measure because we don’t even yet “see” actual productivity, let alone our potential.